I’m having an issue with glLinkProgram in a custom engine I am working on. Previously my game was a mod for GoldSrc/Half-Life 1, where I disabled the renderer and wrote my own version of it. I used GLSL shaders for rendering, and in the version that runs on Half-Life, the shaders load very fast, almost unnoticeably fast.
However since I ported the renderer code to my custom engine, which is a Quake-like engine based on SDL2, I notice that the shaders take very long to load, when compared to the mod version. By that, I mean at least three times slower.
When I profiled the shader loading code, I noticed that it is glLinkProgram that seems to be the offending part. For some reason, in the custom engine this step takes significantly longer than in the original mod version of the renderer. For clarification, the code used to load shaders is pretty much the same as it was in the mod version, with no changes to the way the shader compile/link functions are called. The shader code itself is also exactly the same.
I already asked for help on reddit’s opengl board, but nobody was able to reproduce the slowness I experience with the shader code I supplied. I notice this slowness on both my main PC, which has a Geforce 1050 Ti in it, and on my laptop, which has an Intel GPU. On the laptop the mod version loads fast, but the custom engine loads atrociously slowly, even for very simple shaders. This slowness doesn’t change regardless of how many times a shader has been loaded before, so I don’t think it’s a caching problem.
I’m at a loss for what might be causing this issue, but my guess would be that I am missing something, perhaps a flag set somewhere, but I haven’t yet been able to find the culprit. I would be extremely grateful for any feedback provided.
Ok, I don’t know anything about how the Intel driver does GLSL shader binary caching, so let’s focus on that NVIDIA Geforce 1050 Ti.
Are you using NVIDIA’s Proprietary GPU drivers? Which driver version?
Which OS? (Win10, Linux, etc.)
Have you tried tweaking the parameters for the NVIDIA driver’s shader cache (location, max size, etc.)?
Which disk is your home (or user) directory on, if you haven’t changed the default shader cache location?
Is this a local disk cached by a local file system driver? Or is it a network drive? A RAMdisk? etc.
With the NVIDIA graphics drivers, the glLinkProgram() step can be the most time consuming. However, after it’s completed the first time, the NV driver does cache-off cross-GPU shader binaries for the shader stages (in NVIDIA assembly) in its internal shader cache. You can control where this cache lives and various parameters about its use. But by default it is created under your home / user directory when running as an ordinary user. This is often ideal, but not always (e.g. when the system config is unusual). Apps or the user can internally override the NVIDIA driver shader cache location and usage parameters internally, which might help explain why you see some behavior with some apps and different behavior with others, with the same shader sources.
Also keep in mind that shader compiles+link doesn’t just distill info derived from the GLSL shader sources alone. It also includes some critical GL state information that may be “baked” into the low-level shader binary and used to generate the shader ISA code (SASS) that runs on the GPU when the program is bound and rendered with. So different GL state during the compile/link “may” be a factor. But even if it is a factor, I seriously doubt it’s the main factor given that you’re seeing a 3X+ difference in glLinkProgram() times.
Finally, if you post that test code (or provide a pointer), we can give it a whirl and provide testing feedback and possibly some fixes/workarounds.
Without knowing more, my best guess is that there’s something about the the GLSL compile+link in that custom engine (possibly the environ that it’s running in) that’s disabling or failing to read/write the NVIDIA graphics driver shader cache, causing it to be located on a “slow” disk that isn’t cached in memory by a local file system driver, or is overrunning its maximum size. Any of these could cause perf issues when trying to recompile/relink the exact same shader stage sources into the exact same shader binaries.
Related to all this… Have you considered just saving off and reloading shader binaries as a fast path so as not to be so dependent on each GL driver efficiently implementing shader binary caching behind-the-scenes of GLSL compile+link?
Thanks for your response, I’ll try to address every point you brought up:
1 - Regarding the drivers, I checked in the control panel, and I use the 456.1 version of the nVidia drivers, the ones you can download from the nVidia site. I had used various versions of the drivers in the past, but never noticed this slowness in either case with the HL1 version.
2 - I didn’t try tweaking the shader cache settings in either version, and Half-Life 1 doesn’t by default modify those values at all, since it never used any shaders to begin with, it runs using immediate mode.
3 - As for which disk my home directory is on, it’s the C drive, which in both computers is an SSD, so read/write should be very fast.
Regarding the difference in shader compile times on the laptop, I have one particular shader that, in the mod version links very fast, while in the custom engine version it takes over a second. I can share the shader sources here for that particular shader:
Pastebin Id → u58zjNKi
Also as I said, even the initial linking in the mod version barely took any noticeable amount of time. I mean, at maximum 10 seconds on startup, minus several minutes on the custom engine version.
I’ll try to check all these custom settings you mentioned, and see what differs between the mod and custom engine version.
As for the suggestion about the shader binaries, I only learned about that feature very recently, as I was looking for a solution to this problem. I need to read up on it more to know how I should approach it.
Edit:
I actually tried to find the Intel shader cache on my laptop, and had no such luck. Judging by this, and that the shaders are uniformly slow in the custom engine version regardless of how many times I’ve launched the program, I’m inclined to think that my Intel drivers don’t even cache shaders after the initial linking.
Edit 2:
It seems that setting some flags on the SDL window made the glLinkProgram call a fair bit faster, but still not as fast as the mod version:
Ok. Also, I’m assuming from your mention of “C drive” below that you’re running “Windows 10 (64-bit)”?
Got it. That also addresses one idea I had last night. That being that sometimes the graphics drivers bake custom optimizations for certain inefficient game shaders in popular games. These would probably take a “fast path” through the shader compile system. However, since in your case the original game didn’t use shaders, that’s probably not coming into play here.
Ok, that’s good.
FWIW, I think recent NVIDIA drivers locate that cache here (on Windows) by default:
With the knowledge of where it is and how to control its size, you can nuke that entire directory to observe worst-case compile+link times for an application. This can be useful when timing glCompileShader() and glLinkProgram() to obtain consistent results – and to measure the benefit of having this cache populated vs. not.
So I tried to look this up with the above, but I get a dead link:
Yeah, that is odd. We’ll figure this out. Could it be that the former was in the driver shader cache but the latter wasn’t? Try nuking the NVIDIA driver’s shader cache directory before running each game and explicitly timing the 1) total shader generation time and 2) the specific time elapsed for each individual glCompileShader() and glLinkProgram() call for a specific shader program. Please post those times (so we have some hard numbers to start with).
Yeah, let’s keep this on the back burner right now. We need to figure out why you’re seeing radically different compiling and linking performance with what you think are the exact same GLSL input shader sources.
Ok. After creating the GL context, you might query and print out GL_VERSION, GL_RENDERER, and GL_VENDOR to ensure that you are properly connecting to the NVIDIA OpenGL driver and not some other OpenGL driver implementation.
Also, in all your test cases, you’re running these apps directly on the box in the primary OS displaying to a local monitor, not in some VM or container or logged in remotely via RDP, VNC, etc, correct? Just checking.
Okay, so I did some more testing, and was able to confirm that my Intel drivers do no sort of shader caching whatsoever. This is why the shader load in my custom engine on the Intel one is consistent in load times regardless of how many times I’ve loaded the engine up.
On the PC with the nVidia card however, after an initial, very slow load without on-demand shader loading enabled, the second time I boot it up, it does so lightning fast now. Not sure what I did that changed this, but I was away from my desktop for a week, and inbetween that and now, I made some changes to the renderer code.
When I delete all my shader caches in the nVidia folder, the custom engine loads the shaders slowly again, as expected, but the Half-Life 1 version of the game loads them very fast still. I made sure to see that the mod version does create a shader cache folder, which it does indeed, and I deleted that again to double-check. Even if the cache is deleted, the mod version is lightning fast compared to the custom engine.
Also I tried changing the setting of Shader Cache in the nVidia control panel, but it didn’t seem to have any effect. The shaders were still cached. Same for setting those environment variables, they had no effect whatsoever. The shaders were still being cached, and the folder I couldn’t change either. I will try other ways of setting these variables and see if they have any effect.
Also, sorry for the bad pastebin id, the proper one is u58zjNKi
Regarding your last question, I am running this from a basic Windows 10 system with no extra VMs or environments or anything. It’s a simple 64-bit application running under SDL2. I run it locally. I will take a bit to generate the information you requested about timings, but I’ll update this topic once I am done.
Edit: I also checked the GL strings you mentioned, and they match between the mod and the custom engine.
So, I tested your shaders on a PC with Intel graphics, just to get a second pair of eyes on this.
The GLSL was completely unmodified from the Pastebin you provided, but the shader loader was stripped bare to just glCreateShader/glShaderSource/glCompileShader calls for the VS, then glCreateShader/glShaderSource/glCompileShader calls for the FS, then glCreateProgram/glAttachShader/glAttachShader, finally glLinkProgram.
I took a timestamp at the beginning and between each group of calls above to get insight into how long each step took.
Creating, specifying source, and compiling the vertex shader took about 0.35 milliseconds.
Creating, specifying source, and compiling the fragment shader took about 2.35 milliseconds - it is a longer, more complex shader.
Attaching the shaders to the program was negligible.
Linking the program was measured in isolation and took about 34.9 milliseconds.
I’d suggest that you’ve got a problem in your C++ code here.
Yeah that was my original assumption too, but when I check the timings solely restricted to the functions themselves, I see a massive slowdown with the glShader and glProgram calls in particular.
I tried everything I could think of, but I’m at a loss as to what is causing this. It doesn’t seem to matter if I compile my code in Debug or in Release mode, but I’ll try again with different settings, maybe something is screwing up for me.
I also thought that maybe it’s related to the fact that the Half-Life 1 version runs in 32-bit, but the custom engine is 64-bit, but that shouldn’t cause a problem, should it?
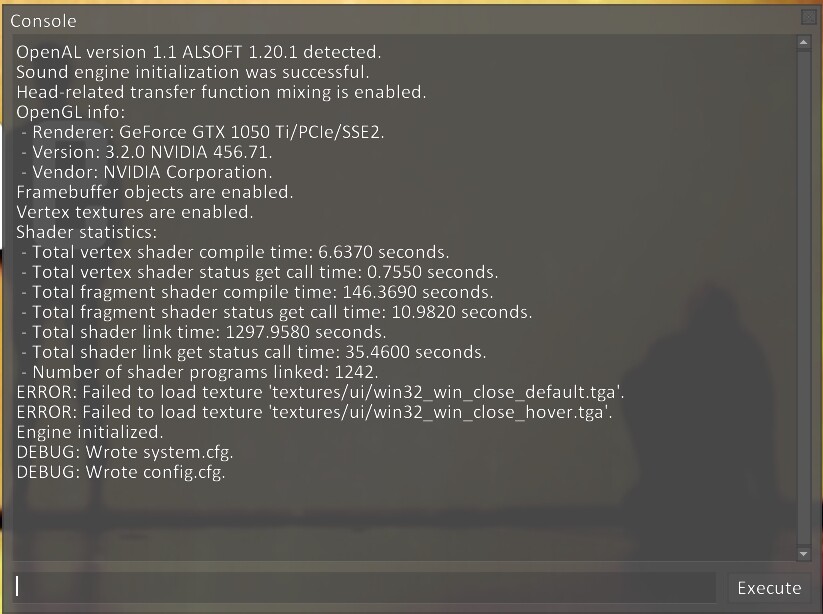
As Dark Photon requested, I’m providing the time statistics in question:
Both of these were done with the shader cache completely nuked, so each application had to recreate the caches completely. I also disabled on-demand shader loading for both, to capture the times for all the shaders used by the application.
Also regarding the large number of shaders: My GLSL class splices up possible shader setups from a single script, and creates all possible permutations(except states marked as invalid inside the shader script, to not have unnecessary/incompatible shader setups). Normally the two largest renderer classes are set to only load shaders on demand, so this high an amount of shaders is never actually loaded under normal circumstances.
Edit:Clarifications.
Edit: Also please disregard the different GL versions shown in the consoles. I forgot to remove the version constraint from the copy I was running this on, and having both at 4.6.0 doesn’t change anything.
Interesting. Well at least your NVIDIA testing results make sense here for the Custom Engine. So now the question is, why isn’t your 1st Half-Life 1 run with reportedly no NV shader cache behaving similarly… (?) The key to all this may be there.
Some games maintain their own local shader cache by relocating it away from the default location. This to avoid other games “polluting” their cache and causing their shaders to need to be recompiled and relinked. How sure are you that Half-Life 1 isn’t doing this (placing its NVIDIA shader cache elsewhere)? If it were, that’d help explain your Half-Life 1 shader build timings.
Thanks for the test results and timings. Actually, it looks like the GL strings don’t all match. That’s a potential problem. More on that below.
To me, your results thus far suggests that either:
The shader source being compiled/linked is different,
The compile/link method is different, and/or
There’s something wildly different about the environment being used to compile/link those shaders.
For now based on the evidence, I’m assuming it’s probably not #1 or #2. So a few ideas about #3:
First, this is concerning:
Half-Life 1:
Renderer: GeForce GTX 1050 Ti/PCIe/SSE2
Version: 4.6.0 NVIDIA 456.71.
Vendor: NVIDIA Corporation
Custom Engine:
Renderer: GeForce GTX 1050 Ti/PCIe/SSE2.
Version: 3.2.0 NVIDIA 456.71.
Vendor: NVIDIA Corporation.
Same GPU, and same NVIDIA driver version. However, wildly different GL context. However, you said:
Ok. Do you know for certain that they were both running the same type of context: Core or Compatibility? The GL_VERSION output doesn’t disclose this.
As a test, I’d copy/paste the PixelFormat creation, Window creation, and GL context creation from “Half-Life 1” into your “Custom Engine”. Use that instead. Ditch SDL2 if you have to (for this test). We want the exact same GL context setup used across both apps.
Second, plug in a GL debug callback and print all the messages coming from the NVIDIA GL driver:
What you’re looking for is any messages which indicate errors or warnings about what your app is doing.
Third, try renaming the Half-Life 1 EXE, nuke the NV driver shader cache, and re-time its 1st-run shader compiles/links. Any difference? Several links online (including this one and this one) tend to suggest that there may be a special Half Life 1 profile in the NVIDIA driver. If so, we want to try and bypass that so it treats Half-Life 1 like any “normal” GL app.
Fourth, you can run the Windows equivalent of strace on the Half-Life 1 EXE to get it to tell you where it’s accessing the NVIDIA shader cache files from. I suspect it’s reading/writing it in someplace besides the default location, at least once it gets to the point of compiling/linking GLSL shaders.
Fifth, let’s take a look at all of your settings in NVIDIA Control Panel → Manage 3D Settings. And under Profiles, make sure you don’t have special profiles for either of the applications you are running.
(Other possibly related tangents to defer for now and possibly come back to later: FB Formats, Constant vertex attribs, HL1 using shader binaries or NVIDIA assembly, parallel compile, direct context, etc.)
Just for kicks, I compiled your frag shader using a number of different NVIDIA. Each produced an NVIDIA assembly result that consumed differing numbers of registers and utlizing different numbers of instructions. Here’s a summary:
fp30 : 595 instructions, 9 R-regs, 0 H-regs
fp40 : 493 instructions, 10 R-regs, 0 H-regs
gp4fp : 604 instructions, 7 R-regs
gp5fp : 604 instructions, 7 R-regs
This is all for that same GLSL fragment shader you posted, which targets GLSL version 140.
Due to the differing GL context versions, that could be that your apps are encouraging NVIDIA’s internal GLSL compiler to take a completely different path with the same GLSL shader stage sources.
Hey, here’s a long shot for you. In your Half Life 1 startup log, look for some lines like this:
Loaded program cache file "glbaseshaders.cfg", total keyvalues: 266, total successfully linked: 266
Loaded program cache file "glshaders.cfg", total keyvalues: 330, total successfully linked: 330
Precache: Took 2295 ms, Vertex 1589, Pixel 1475
or this:
Could not load program cache file glbaseshaders.cfg
Could not find base GL shader cache file
Could not load program cache file glshaders.cfg
Could not find user GL shader cache file
Precache: Took 0 ms, Vertex 0, Pixel 0
Basically, anything related to “program cache”, “shader cache”, “glbaseshaders.cfg”, or “glshaders.cfg”.
Not sure if this is HL2+ only or not, but I did see one link where there were logs like this, but it was loading up “Half-Life 1” (see the last line below):
Could not load program cache file glbaseshaders.cfg
Could not find base GL shader cache file
IDirect3DDevice9::CreatePixelShader: shaderapi's centroid mask (0x00000000) differs from mask derived from shader name (0x0000000C) for shader ps-file flashlight_ps20b ps-index 96 ps-combo 0
IDirect3DDevice9::CreatePixelShader: shaderapi's centroid mask (0x00000000) differs from mask derived from shader name (0x0000000C) for shader ps-file flashlight_ps20b ps-index 96 ps-combo 1
IDirect3DDevice9::CreatePixelShader: shaderapi's centroid mask (0x00000000) differs from mask derived from shader name (0x0000000C) for shader ps-file flashlight_ps20b ps-index 96 ps-combo 2
IDirect3DDevice9::CreatePixelShader: shaderapi's centroid mask (0x00000000) differs from mask derived from shader name (0x0000000C) for shader ps-file flashlight_ps20b ps-index 96 ps-combo 3
IDirect3DDevice9::CreatePixelShader: shaderapi's centroid mask (0x00000000) differs from mask derived from shader name (0x0000000C) for shader ps-file flashlight_ps20b ps-index 120 ps-combo 0
IDirect3DDevice9::CreatePixelShader: shaderapi's centroid mask (0x00000000) differs from mask derived from shader name (0x0000000C) for shader ps-file flashlight_ps20b ps-index 120 ps-combo 1
IDirect3DDevice9::CreatePixelShader: shaderapi's centroid mask (0x00000000) differs from mask derived from shader name (0x0000000C) for shader ps-file flashlight_ps20b ps-index 120 ps-combo 2
IDirect3DDevice9::CreatePixelShader: shaderapi's centroid mask (0x00000000) differs from mask derived from shader name (0x0000000C) for shader ps-file flashlight_ps20b ps-index 120 ps-combo 3
IDirect3DDevice9::CreatePixelShader: shaderapi's centroid mask (0x00000000) differs from mask derived from shader name (0x0000000C) for shader ps-file flashlight_ps20b ps-index 0 ps-combo 0
IDirect3DDevice9::CreatePixelShader: shaderapi's centroid mask (0x00000000) differs from mask derived from shader name (0x0000000C) for shader ps-file flashlight_ps20b ps-index 0 ps-combo 1
IDirect3DDevice9::CreatePixelShader: shaderapi's centroid mask (0x00000000) differs from mask derived from shader name (0x0000000C) for shader ps-file flashlight_ps20b ps-index 0 ps-combo 2
IDirect3DDevice9::CreatePixelShader: shaderapi's centroid mask (0x00000000) differs from mask derived from shader name (0x0000000C) for shader ps-file flashlight_ps20b ps-index 0 ps-combo 3
Loaded program cache file "glshaders.cfg", total keyvalues: 125, total successfully linked: 125
Precache: Took 7213 ms, Vertex 360, Pixel 430
Game.so loaded for "Half-Life 1"
Thanks for the feedback, I will try to check everything you mentioned, it’s gonna take a bit. I have enabled OpenGL debug callback messages for my custom engine, and currently I don’t see anything unusual, just some feedback about the VBOs, but nothing like an error or a warning at all. I initialize debug callbacks directly after creating the window.
Regaring the shader cache, I am pretty much 100% positive that Half-Life doesn’t do anything in regards to shaders, since the entire engine runs on code from like 1998, and they haven’t updated anything to use shaders, but I will check the points you mentioned anyway, just to be sure.
Another reason why I am confident that HL1 doesn’t modify anything in regards to the cache, is that when I compared the two caches created by the custom engine and Pathos, their sizes were almost identical, with all shaders compiled at once and on-demand loading being disabled.
My best guess would be that in the custom engine, OpenGL is doing something extra, that it does not do for Half-Life 1, and this is dependent on some kind of flag or setting within OpenGL. If push comes to shove, I will strip out SDL2 and try without it, but that would be a major pain in the ass.
Regarding context type, I will need to check in the mod version, I’ll come back with more information on that later. I also tried renaming the HL1 executable as you said and nuking the shaders, but I still get the same result, no major differences at all. One more thing I can try, is running the mod version on a clean computer where I haven’t run these shaders yet, and see how fast the shaders compile.
I will try to debug and analyze the Half-Life version more also in the meantime, to see if any pointers come up that would help me.
Edit:
A friend of mine tried the binaries compiled on my machine on an RTX 2070, and it took him 15 seconds total, with the shader cache nuked. This at least means it’s something on my side that might be a setting somewhere in the system. I’m gonna keep investigating.
He also suggested that it could be a priority issue with the program. What are your thoughts? I’ll investigate more tomorrow, but after 10 hours of constantly debugging this, I can’t fathom spending another minute on it.
Edit:
Okay, I feel kind of stupid now. I was always running my custom engine through the VS debugger, and now on my friend’s advice I tried running it from a shortcut. The shaders now compile super fast, as expected, even if I nuke the cache. Obviously the slowdown is caused by something related to debugging. I’m going to investigate further.
Okay, after trying everything, I ended up figuring this one out. It seems that the issue was caused by me using the Visual Leak Detector. It didn’t occur to me that it could be the cause until my friend helped out and the issue recurred the next day, and I thought it only checked for leaks locally, and not in the dependencies as well.
@mhagain Turns out you were completely right, it was an issue in my code. Thanks.
@Dark_Photon Thanks again for all your help, I really apprechiate the effort and time you put into this.
For anyone else who might come here with similar problems, keep an eye on anything you use as a profiler/leak detector/etc.
Glad you got this sorted! Also good to have a concrete and reproducible explanation rather than “the drivers are weird” (which can happen all too often).
I’m not sure, I’ll have to investigate. It’s possible this could be a bug with VLD and VS2010, or I have some kind of preprocessor define present in Release that ends up still including VLD for some reason. I know I kind of messed around with something related to this way, way back in the day. I’ll check and let you know.
@Dark_Photon I looked into this more, but I couldn’t find the reason. I don’t have any kind of preprocessor defines that would cause VLD to be included with the engine executable in Release mode. One possibility, which I will have to test, is that I might’ve run the game in “EngineRelease” mode, which means that the engine is compiled in Release mode, but the server and client libraries are compiled in Debug. Those also include VLD, and maybe that can still cause such a slowdown. I’ll update this reply if I find out more.
Ok, thanks for the feedback. Please don’t go to any special trouble to dig further if it wouldn’t benefit you. I was just curious (both in case I use VLD at some point or in case it might be useful to others that have a similar problem and look through your thread for solutions).