I am now doing some optimization for rendering process. I notice that in my game some objects is totally static and never changed.
In my old way, I will create a uniform buffer every frame, and put variables in it, such as objectToWorldMatrix, LightData etc. Then use glBindBufferBase to bind buffer to right slot. The glBindBufferBase cost 0.03ms ~ 0.05ms for 376 objects.
In my new way, I will cache the uniform buffer and just use glBindBufferBase to bind my cached buffer every frame. The glBindBufferBase will cost 0.13ms ~ 0.21ms for 376 objects.
The results is so weird. Why are costs of glBindBufferBase different? Did I miss some special optimization for new created buffer?
Furthermore, Do I need to call glBindBufferBase in every frame if the buffer is constant? Some people say OpenGL is a state machine and setting will not be changed unless you change it. However, I found if I just set it once, my objects would not be rendered.
Unless you have specific guidance from the OpenGL ES driver writer to the contrary, you shouldn’t expect creation or allocation of resources from scratch to be fast. It could be triggering implicit sync (which may allow subsequent commands queue faster). I would suggest never putting this kind of thing in your “draw loop”.
Also, assuming you’re reporting CPU draw thread timings here, keep in mind that this is not the cost for performing the glBindBufferBase() operation. It’s how long it takes the OpenGL ES driver to queue the request (to perform this operation later). There’s a big difference. Especially on mobile GPUs (where unless you goofed up, most operations are queued until later).
The buffer contents are static (non-changing), correct? Content updates to reused buffer objects can be slow on mobile GPU drivers (often triggering implicit sync), unless you’re very careful. So I just want to verify that updates are not involved here.
Also, you’re talking like this is a single buffer shared across multiple batches, but you’re also saying glBindBufferBase() instead of glBindBufferRange(). Is there 1 bind per frame and you’re indexing into the buffer object in the shader?
It’s just whatever the driver needs to do to queue this command in the command queue. Unless the elapsed time to queue it is long, I wouldn’t obsess about fractional milliseconds of cost difference to queue one command. I’d place more value in the total time needed to queue your frame.
No, assuming the binding hasn’t been changed.
Keep in mind however that glBindBufferBase() and glBindBufferRange also update the non-indexed buffer bind point for that bind target (i.e. act as if glBindBuffer() had also been called). Your code may not be written to expect this.
I think you’re just shifting around where queuing work is done in the driver.
I am using an i7-10700k and [an NVIDIA RTX] 2070 super with driver 457.51, but my target platform is Android. I’ve test it on Android and it have the same issue like PC.
Yes, the buffer contents are static in my new way. It is not 1 bind per frame. It is depends on the batch size of that frame. Each static object has its unique buffer. It is like:
Since the data is static, you can reduce the total UBO bind cost by:
storing the data for many (or all) of your objects in the same uniform buffer object (UBO),
doing 1 shared bind for all, and then just
indexing the UBO in the shader to pull the data for the objects you want to draw.
If you need variable-length data, you can use a shader storage buffer object (SSBO) instead, or just overallocate the UBO.
Similarly, you can reduce the total bind cost for other buffer objects (VBOs, IBOs, SSBOs, Draw Indirect, etc.) by:
merging batches into a smaller set of buffer objects,
doing 1 set of binds at top-of-frame, and
dispatching draw calls using offsets into those buffer objects rather than binds + offsets.
Similarly, you can reduce your total draw call cost by merging batches (dispatching multiple per draw).
Any of the above should reduce your total buffer object bind cost (including UBOs) on both setups (NVIDIA RTX 2070 Super PC and Android).
On NVIDIA, you additionally have the option to ditch the UBO binding and use bindless (GPU addresses) to access the UBO. It’s pretty much just:
Make the buffer object GPU resident (glMakeBufferResidentNV()),
glEnableClientState( GL_UNIFORM_BUFFER_UNIFIED_NV ), and
Use glBufferAddressRangeNV( GL_UNIFORM_BUFFER_ADDRESS_NV ) to provide the GPU address of your UBO to the OpenGL driver.
Of course, you can also use the other NVIDIA Bindless Graphics extensions to bypass binding for other buffer objects, effectively doing the same thing for the vertex buffer objects, index buffer objects (if any), and other buffer objects used by draw calls (except SSBOs). See below for NVIDIA bindless-related extensions.
With NVIDIA Bindless Graphics, you can get the fastest draw call submission performance (comparable to using their display lists) on NVIDIA GPUs, for a given buffer object arrangement and set of draw calls. The more you merge buffer objects and batches, the less total speed-up you get from bindless. And that works on any platform.
NVIDIA OpenGL Extensions related to Bindless Graphics:
Bindless VBOs / IBOs (and shader reads via GPU pointers):
storing the data for many (or all) of your objects in the same uniform buffer object (UBO)
Does it mean I need a very big buffer for all static objects? If I have a lot of objects in the scene, the buffer will be very big. I think may it has a limitation on size.
indexing the UBO in the shader to pull the data for the objects you want to draw.
I don’t understand this part. Do I need to use glBindBufferRange with offsets? I have a big buffer now, I need glBindBufferRange to bind right?
Yes. It doesn’t necessarily require all static objects in one buffer object. However, if you think max UBO size may be an issue, keep in mind that GL_MAX_UNIFORM_BLOCK_SIZE is not the maximum size for a buffer object storing UBO data, but rather the maximum subsection of that buffer object (or any buffer object) that you can map into a single binding index in the shader at any given time. You can have a massive buffer object storing multiple chunks of UBO data. Or you can split this across multiple buffer objects if you want.
Alternatively, you could use one big SSBO instead. SSBOs have the advantage that the actual size of the block known to the shader can be dynamic (i.e. not compiled into the shader but determined later by what buffer object you bind), as well as having a GL_MAX_SHADER_STORAGE_BLOCK_SIZE that’s typically very large (compared to GL_MAX_UNIFORM_BLOCK_SIZE).
I’m just trying to figure out what you were doing.
glBindBufferBase() binds the whole buffer object to an indexed bind target.
glBindBufferRange() binds a part of a buffer object to an indexed bind target (could be whole)
If you store the uniform data for multiple batches (draws) in a single, shared buffer object, you have to do something so that the shader reads in the correct part of the buffer object for that draw. There are a lot of options here.
One is you could use glBindBufferRange() per draw call so that only the correct part of the buffer object is “attached” to the shader for that one draw call.
Another is you could use glBindBufferBase() (or glBindBufferRange()) to bind a portion of the buffer with the uniforms for many draw calls. Then inside of your shader, offset your lookups so they pull the correct block of uniforms for this draw. With GLSL struct arrays, this is super-easy, and the compiler does the offset math for you. For instance:
int index = ...;
mat4 mat = mySSBO.drawData[ index ].modelview;
...
Same thing applies whether using an SSBO or a UBO. However, with a UBO you must specify a fixed-length array for drawData[] and not leave it open-ended. And you need to follow std140 alignment rules instead of std430.
Thank you very much. In fact, I am trying to do some optimization for Unity. Now I am still suffering from doing binding operation every frame. I found that Unity clears all bindings in the beginning of each frame.
I have no idea why does Unity clear all bindings in the beginning. Does it assume most of objects in my scene are dynamic(objs needed to be updated their UBOs very frame)? I am guessing if I have a lot of dynamic objects, clearing all bindings in the beginning and assign bindings later may boost rendering performance?
You’ll have to ask the Unity guys to be sure, but after seeing this, my guess is that they do state tracking (aka lazy state changes), one method of state change reduction.
This basically involves wrapping sometimes-expensive graphics API state changes with little “if this value == last-set value, skip it” wrappers.
The pro is it can save time avoiding needless calls into the graphics API. One con though is that if some code doesn’t make use of these wrappers to change state (or if there’s a bug in them), this can result in “state leaks”. That is, cases where the app thinks the state is X but in OpenGL it’s really Y, leading to misbehavior caused by rendering or updating with the wrong GL state active.
To guard against this, sometimes state tracking engines will use “state reset” sequences at the top of each frame like this, to force the actual state and tracked state to be identical again. This doesn’t always “clean up the mess” left by the state leak, but it’s often better than just leaving the state mismatch out there until the end of the run to cause more havok.
I’ll take your word for that, but so far I haven’t seen compelling evidence that you’re really suffering from buffer binding cost. You’re reporting total time across many BindBuffer calls of fractions of a msec.
Even if there was a slowdown here, my guess is that the bind isn’t what’s expensive, but the work the driver decides it needs to catch up on to queue the bind operation.
Question:
You still haven’t answered this. What’s the scoop?
You have said the “the buffer is constant”. But given the above, I’m starting to suspect that the buffer “binding” is constant, but the buffer “contents” are changing every frame. And that could very well affect the cost you see associated with binding a buffer object.
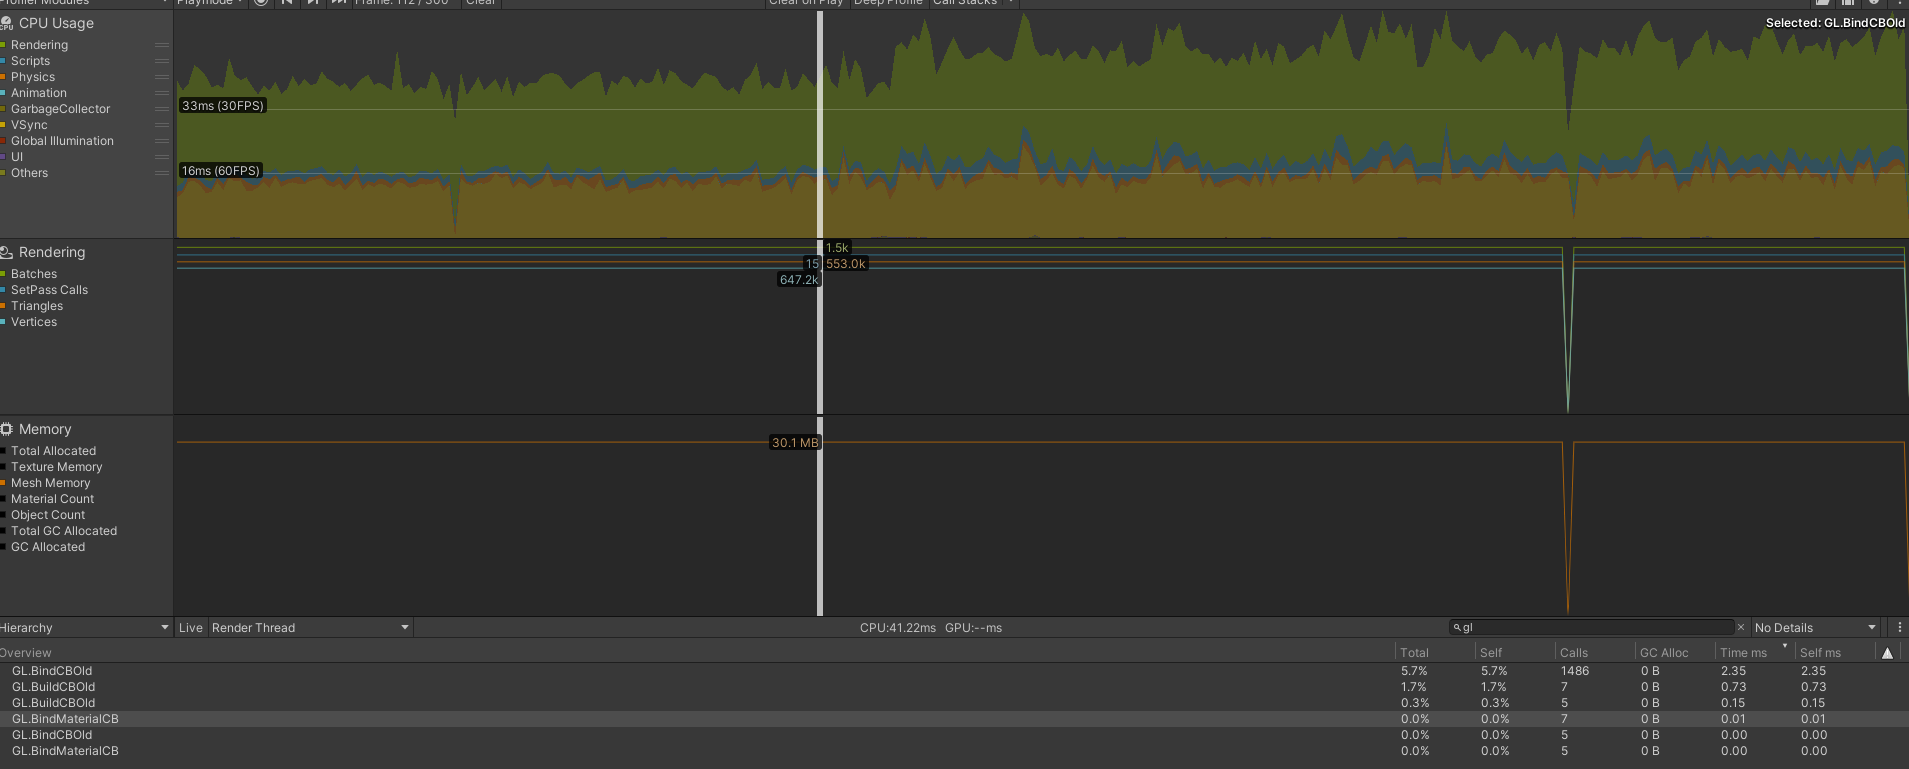
In the new way, 1486 calls of binding operation is 3.63ms.
It is obvious that my rendering thread takes longer time after using new way, although I’ve cached the buffer and don’t need to create the buffer every frame.
You’re talking times of 1-2 microseconds ( μsec) per call. Seems pretty reasonable to me.
I think you’re doing the right thing with trying to eliminate needlessly creating and changing of buffer objects every frame.
Going forward, I think I’d first minimize your test setup to avoid interactions with other pieces. Namely, disable all content and effects except that which makes use of these buffer objects. Re-bench. Make sure your assumptions still hold. Then I’d look at combining all of those many buffer objects into 1 or a smaller set. That should allow you to get rid of most or all of those binds. Then you can recheck perf and see if you’ve really saved that cost you’re ascribing to the bind calls.
In my game, there are 9 areas. Each time when I enter the area, I will load some objects to the scene. So I need to update my big buffer when I cross the area.
I find everytime I cross the area, my scene will be messed up in one frame. It is like the buffer has some garbage data on that specific frame.
Firstly, I feel I am updating the buffer when GPU is using that buffer. However, I find Unity is always doing stuff like: game logic → prepare data for rendering → dispatch command to render thread->waiting for the GPU to finish job → next frame. It seems my updating cannot affect GPU because GPU has finished its job of the last frame.
Is this on a mobile GPU (if so, which?)? Or still on the PC with NVIDIA RTX 2070?
Is your “big buffer” used by the vertex shader, the fragment shader, or both (objectToWorldMatrix + LightData makes me think possibly both).
First, are you clearing your color/depth/stencil buffers at the beginning of rendering a frame, and invalidating the depth/stencil buffer at the end of the frame? If not, you should start. That saves huge bandwidth on mobile GPUs shuffling garbage data around that you don’t care about. It can also get rid of garbage color output on a mid-frame flush, if your GL call sequence is “unlucky” enough to trigger one (or really, hasn’t been designed to properly avoid them from happening at all).
Could be, particularly if this is a mobile GPU, and the “big buffer” is being read by your fragment shaders.
How do you know that for sure? That is not the usual method of rendering, and it will kill your frame rate on mobile GPUs.
That said, this does suggest something you could try in debugging this problem. Ignore frame rate and throughput, and “for testing only” put a glFinish after the last rendering command in a frame (e.g. right after calling eglSwapBuffers()). See if this has any effect on the appearance of your artifact (“my scene will be messed up in one frame”). If it goes away, we’re onto something.
On mobile GPUs, depending on the driver architecture, updating buffer objects that are read by the vertex pipe (e.g. vertex shader) can cause a vertex pipeline flush (Imagination Tech / PowerVR calls this a “TA kick”), whereas updating buffer objects that are read by the fragment pipe (e.g. fragment shader) can cause a fragment pipeline flush (often referred to as a full pipeline flush). The latter, regardless of how triggered, will cause mid-frame of your framebuffer, often leading to partially-rendered frames, possibly containing garbage if you’re not clearing your color buffer beforehand like you’re supposed to.
If the cause is what I’m considering, the usual solution is to have a circular ring of buffer objects instead of just 1. Update them in round-robin fashion so that a buffer object is never updated until ~3 frames after a command was last submitted to the GPU that read from that buffer object.
I’d point you to a good web page on imgtec.com for this, but it seems Imagination Tech has cleaned house of some of their prior content. So here it is from Google cache. Flip to “Text-only version” to actually read this article, and skip down to “VBO updates” for the part that most closely relates to this. Note that this only discussed the vertex pipe flush part:
I am still using PC with 2070s. But on mobile it has the similar issue.
Both.
Yes, all buffers are cleaned in the beginning, and invalidating the depth/stencil buffer at the end of the frame.
I have solved the issue with the method similar to your mentioned. I don’t use the ring buffer. But I will only use my big buffer to render the scene when the scene is stable. That is, I will only update the big buffer if the scene is not loading/unloading in the last 3 frames, and use the big buffer to do rendering if the scene is not loading/unloading in the last 5 frames. Otherwise, I will use the Unity default method as a fallback to do rendering.
You mentioned that
That is not the usual method of rendering, and it will kill your frame rate on mobile GPUs
I don’t get the point. Why do you say it is not a usual method? I am not sure I am 100% correct for what I said, because I haven’t digged into the source code for this part. This was just what I saw from the profiler.
Ok. That you’re seeing this on a mobile GPU isn’t surprising (full-pipe mid-frame flushes can do that). The garbage despite buffer clearing up-front could be explained by mid-frame depth/stencil clears, which can yield garbage-like effects due to incorrect depth/stencil tests after the flush.
However, that you also see this on a desktop NVIDIA RTX 2070 GPU is surprising! (I say that after having written/debugged GL software on NVIDIA GPUs for many years.)
On that 2070, are you running the latest NVIDIA drivers? I honestly have never seen this artifact on an NVIDIA desktop GPU. You’re not doing something sketchy like MAP_UNSYNCHRONIZED without proper orphaning or sync objs between overwrites, are you? I could see that maybe producing this artifact on the NVIDIA.
(And actually (related to sync objects), on mobile, a sync object wait can produce a full-pipeline flush – can’t use that there. You actually have to be very careful to get MAP_UNSYNCHRONIZED updates to work properly on mobile without instigating full-pipeline flushes (been there, done that), and may have to ditch them completely on mobile depending on driver support.)
That fits too (on mobile at least). On mobile GPUs, use conflict in the vertex pipe would flush the vertex pipe. Use conflict in the fragment pipe would flush both vertex and fragment.
Glad to hear it! That works too!
Forgive me here if I say something below that you already know. But in the interests of this being clear without knowing what you know…
When you submit API calls to GL, you’re not telling GL to “execute this right now and then return”. You’re telling it to “queue this thing for execution later, and return immediately”. This is true whether you’re talking about a discrete desktop GPU (sort-last architecture) or a mobile/embedded GPU (sort-middle architecture).
Both desktop and mobile GPU drivers take advantage of this by generally letting CPU queuing (your draw thread) get 1-3 frames ahead of actual GPU rendering execution. Think of this like a long rope where the CPU is dragging the GPU along behind it. They can each speed-up and slow-down, but because of this rope, there’s less likelihood that one stalling will stall the other. Both desktop and GPU drivers can make use of this to improve GPU submission efficiency and (sometimes) hide stalls that would otherwise happen if there were no slack between them. Though this does come at the cost of increased rendering latency.
Mobile GPUs in particular are absolutely dependent on this queue-ahead behavior for good performance. , This because of their radically different tile-based rasterization architecture, In fact, they:
queue up all the commands needed to fully render to each individual framebuffer completely
(glClear -to- glBlitFramebuffers or eglSwapBuffers, for instance) and
pre-transform all of the vertices (i.e. run the vertex shader executions)
potentially before they will:
rasterize a single color pixel for this framebuffer.
This queue-ahead allows the driver to pre-sort all of the rasterization work you gave it by framebuffer tile and rasterize each tile completely all-at-once. Because it’s all-at-once, this tile rasterization work can be done in super-fast high-speed on-chip cache, as opposed to the the relatively slow DRAM that often provides GPU memory storage on these mobile/embedded GPUs.
This rendering architecture provides massive main memory framebuffer bandwidth savings during rasterization, while still allowing use of slow commercial DRAM for the GPU memory store. However, to get these gains without tanking frame throughput, it’s completely dependent on that queue-ahead rope, so it can re-sort the work you gave it for maximum rasterization efficiency.
Anyway, for this reason on mobile GPUs, frame rasterization often occurs 1-2 frames after the CPU has queued it. If you (for instance) just drop a glFinish() in your frame someplace, you’ll totally thwart its ability to defer rasterization, and you’ll most likely cut your max frame rate by 2X or 3X. Plus if you throw that in the middle of your frame, you’ll get mid-frame full pipeline flushes which yields partially rendered results and/or garbage on-screen.