Hi
I am new to openGL but i have created the image scrolling application using SDL 2.0 that gives inconsistent smooth.
Can i get image scrolling source using openGL ? Looking forward it.
Many Thanks.
Hi
I am new to openGL but i have created the image scrolling application using SDL 2.0 that gives inconsistent smooth.
Can i get image scrolling source using openGL ? Looking forward it.
Many Thanks.
Describe what you’re doing (specifically), what problems you’re having with it, and what you have tried to resolve the problem and the results, and I’ll bet someone here will chime in with some ideas for you to try. Post a code snippet to increase your chances of a useful reply.
For tips in constructing your post to maximize the chance of useful feedback, please see The Forum Posting Guidelines. In particular, Posting Guidelines #4 and #5.
HI
Thanks for your response.
Hi
Currently we are using sdl application for scrolling large tiff files (1 bit depth) with a resolution ranging from 1000 dpi to 2000 dpi approximately image width 51840 and height 115200.
This we are doing using tile function i.e cropping the input image into smaller images of width and height 540 X 1080 size and the scrolling them parallel in a matrix format on a row by row basis…however there is a minor stuttering observed while doing so…we have observed that the scrolling is not being done uniformly across all the rows in a consistent fashion, the scrolling velocity in fps remains inconsistent across different rows i.e out of 10 rows 5 rows give an inconsistent performance.
We have tried using vsync, hardware acceleration, software acceleration etc but the problem is still persistent.
Image information
Image DPI - 1000 dpi and 2000 dpi
Image width and height = Width - 51840 and Height - 115200
Image size in MB - 711 MB.
Cropped image are = Width and height 540 and 1080.
The system configuration is :
Intel core i5 7th generation processor, 8 gb ddr4 ram, windows 8.1 os and 2gb nvidia graphic card ( recently added ) and a lcd monitor with 60hz frequency.
Even after trying with hardware acceleration on a gpu there seems to be no change in scrolling, we are still not sure if the graphic card is being utilized or not.
Also i am attaching the source code which were using that using SDL 2.0. i hope openGL will fix the issue. any solution in openGL.
I can’t able to attache the source code here and also link to source.
Kindly do the needful. Many Thanks.
Ok, so 5.6 Gtexels for 1 image. 695 MB, if it can be kept bit-packed at 8 texels per byte.
Ok.
Questions:
The key to fixing this is profiling to find your largest bottleneck that’s causing the stuttering while scrolling. That’s what you need to do first. Then you can eliminate that bottleneck.
Which one?
If you’re bottlenecked on the CPU, you could throw a top-of-the-line GPU at this and it’s not going to fix the problem. You need to profile to identify the primary bottleneck driving the stuttering during scrolling. My guess is that’s going to be either disk paging or inefficiencies with way GPU paging is being performed.
Hi
Thanks for your detailed response.
NO. How can i run the CPU profiler in SDL? Guide me.
NOT full image loaded. parts by parts like 540X1080 image size only loaded.
NOT full image loaded. parts by parts like 540X1080 image size only loaded.
No idea. How can i share my source code here, tried to attached not support and link also.
Shall i paste full source code here. Guide me.
You need to see my source.
You need to see my source.
How can i check my sdl image scrolling application using internal/external graphics card or not?
Looking forward from your support to fix the issue.
Many Thanks.
It’s not in SDL. SDL is just a library.
You run a CPU profiler on your entire application. That tells you where you’re spending the bulk of your time (on the CPU). Be sure to profile when you’re scrolling heavily to exercise the code paths with the bottleneck(s) in them.
You need to look at the available CPU profiling options on your platform, pick one, and learn to use it.
Then it’s very likely (given that it doesn’t sound like you’ve even started profiling yet) that your main bottleneck is with disk loading of the image into RAM. This has nothing to do with OpenGL, graphics drivers, or the GPU.
If you’re loading from disk on the same thread that you’re using for OpenGL rendering, then it is almost definitely the bottleneck. I’ve seen production systems designed and implemented with disk loading on the draw thread, and this fails miserably when they start trying to achieve consistent frame rates.
Step #1: Run a CPU profiler on your app. A CPU profiler will reveal where you are spending all your time. If it’s loading from disk, it will reveal that.
Ok, well you need to know (or figure out) what your application is doing. If you don’t, you can’t optimize it.
Step #1 is to run a CPU profiler on your app. If it reveals that the bottleneck is related to OpenGL, and that prompts a specific OpenGL question, feel free to post it here. If it reveals that the bottleneck isn’t related to OpenGL, you need to go solve that first.
Answering my question about what GL internal texture format you’re using doesn’t involve posting any code. You need to get into that code and figure it out. But in the future, you can post code by copy-pasting it between lines with only 3 back-ticks on them (```). For example :
   glAttachShader ( pgm, vs );
   glAttachShader ( pgm, gs );
   glLinkProgram  ( pgm );
No, step #1 is run a CPU profiler and determine where your bottlenecks are.
You can run one of any number of GPU/graphics driver information apps to see whether your graphics drivers are installed properly. For instance:
And in your application, you can print out the values of GL_RENDERER and GL_VERSION to verify that you are connected to the correct GPU through the same graphics driver.
However, this is really academic at this point. Step #1 is to run a CPU profiler to determine your bottlenecks when scrolling. Be sure to profile across frames when you are scrolling heavily to capture those bottlenecks. You might also consider snapping some timers around major parts of your CPU frames (especially disk loading) and logging them to catch when one part pops up and takes hundreds of milliseconds.
HI
Thanks for your response.
I am checking with visual studio profiler. will update you once done.
I am using SDL application only not using openGL, i have posted the query in SDL forum NO response form them, so i thought i could have get solution in openGL forum changing SDL application to openGL.
I will check the GPU part using the software which you shared the link.
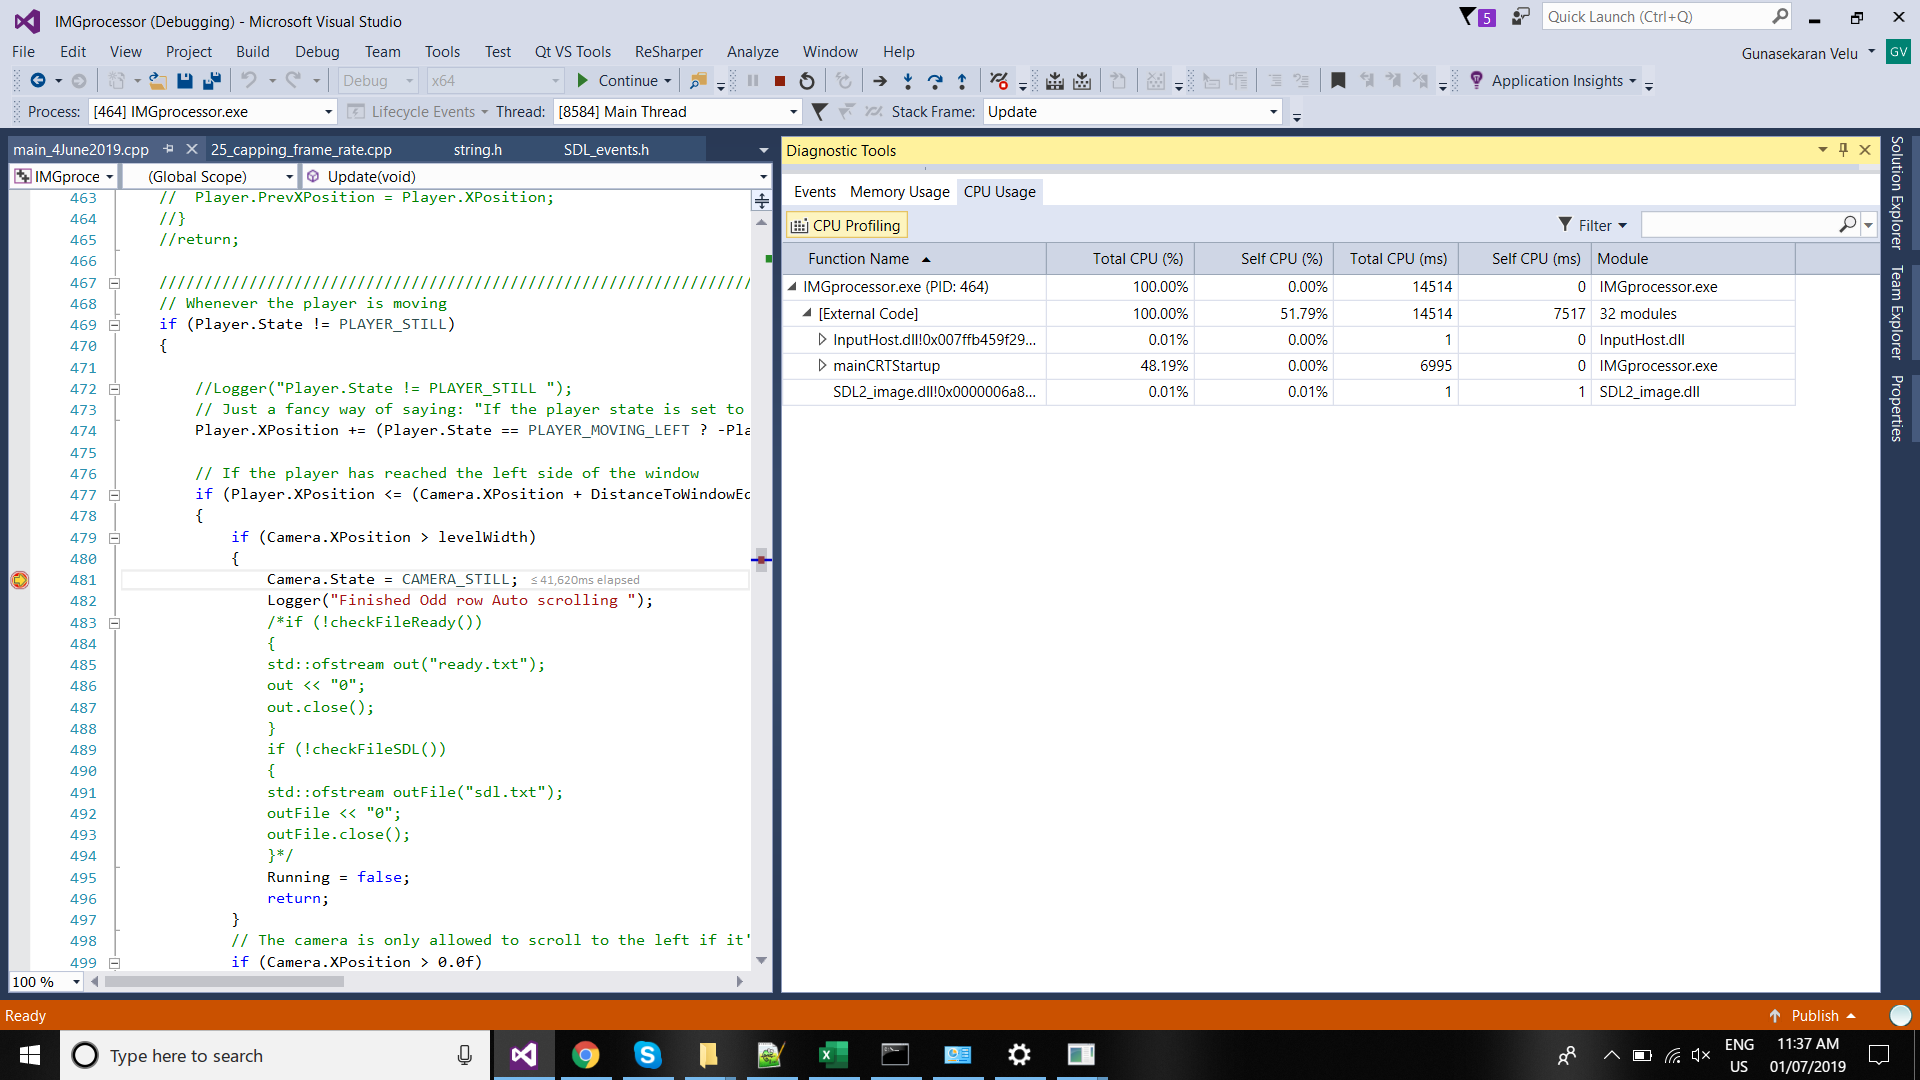
Attached CPU profiler. Chec and update me.
Also attached source here…
#include <iostream>
#include <string>
#include <atlconv.h>
#include <SDL.h>
#include <SDL_image.h>
#include <time.h>
#include <windows.h>
#include <string.h>
#include <conio.h>
#include <process.h>
#include <stdio.h>
#include<fstream>
#include <filesystem>
#include <dos.h>
#include <sstream>
using namespace std;
SDL_Texture*	CreateTexture(const std::string& rPath);
bool		QuadVsQuad(const SDL_Rect& rQuad1, const SDL_Rect& rQuad2);
float		Interpolate(const float Start, const float End, const float Fraction);
bool		InitializeSDL(void);
void		DeinitializeSDL(void);
bool		Create(void);
void		Destroy(void);
void		HandleEvents(void);
void		Update(void);
void		Render(void);
void		Logger(string);
bool		checkFileProcess();
bool		checkFileSDL();
bool		checkFileReady();
int WindowWidth = 0;
int WindowHeight = 0;
int sectionWidth = 0;
int numSection = 0;
int levelWidth = 0;
int balanceWidth = 0;
int oddEvenRow = 0;
int indexHeight = 0;
int WindowStartPosInSecondScreen = 0;
int WindowsStartYposInSecondScreen = 0;
std::string fileName;
int startFlag = 0;
int delayTimer = 0;
DWORD m_dwIP = 0;
int cameraStartPosition = 0;
enum EPlayerState
{
	PLAYER_STILL = 0,
	PLAYER_MOVING_LEFT,
	PLAYER_MOVING_RIGHT,
	NUM_PLAYER_STATES
};
enum ECameraState
{
	CAMERA_STILL = 0,
	CAMERA_SCROLLING_LEFT,
	CAMERA_SCROLLING_RIGHT,
	NUM_CAMERA_STATES
};
struct SPlayer
{
	float		Width = 0.0f;
	float		Height = 0.0f;
	float		XPosition = 0;
	float		PrevXPosition = XPosition;
	float		Velocity = 0.0f;
	EPlayerState	State = PLAYER_STILL;
};
struct SCamera
{
	float		XPosition = 0.0f;
	float		PrevXPosition = XPosition;
	float		Velocity = 0.0f;
	ECameraState	State = CAMERA_STILL;
	SDL_Rect	Quad;
};
struct STexture
{
	SDL_Texture*	pTexture = nullptr;
	SDL_Rect	Quad;
};
SDL_Window*	pWindow = nullptr;
SDL_Renderer*	pRenderer = nullptr;
SDL_Event Event;
double DeltaTime = 0.0;
double OldTime = 0.0;
double NewTime = 0.0;
float DistanceToWindowEdge = 0.0f;
static bool Running = true;
SPlayer	 Player;
SCamera	 Camera;
STexture *BackgroundTexture;
SDL_Texture* CreateTexture(const std::string& rPath)
{
	SDL_Surface* pSurface = IMG_Load(rPath.c_str());
	if (!pSurface)
	{
		std::cout << "Failed to create SDL surface. " << IMG_GetError() << std::endl;
		Logger("Failed to create SDL surface.");
		return nullptr;
	}
	else
	{
		Logger("Success to create SDL surface.");
	}
	SDL_Texture* pTexture = SDL_CreateTextureFromSurface(pRenderer, pSurface);
	SDL_FreeSurface(pSurface);
	pSurface = nullptr;
	if (!pTexture)
	{
		std::cout << "Failed to create SDL texture. " << SDL_GetError() << std::endl;
		Logger("Failed to create SDL texture.");
		return nullptr;
	}
	else
	{
		Logger("Success to create SDL texture.");
	}
	return pTexture;
}
bool QuadVsQuad(const SDL_Rect& rQuad1, const SDL_Rect& rQuad2)
{
	if (rQuad1.x		< rQuad2.x + rQuad2.w	&&
		rQuad1.x + rQuad1.w	> rQuad2.x		&&
		rQuad1.y		< rQuad2.y + rQuad2.h	&&
		rQuad1.y + rQuad1.h	> rQuad2.y)
		return true;
	else
		return false;
}
bool InitializeSDL()
{
	if (SDL_Init(SDL_INIT_VIDEO + SDL_INIT_JOYSTICK) < 0)
	{
		std::cout << "Failed to initialize SDL. " << SDL_GetError() << std::endl;
		Logger("Failed to initialize SDL");
		return false;
	}
	else
		Logger("Success to initialize SDL.");
	if (IMG_Init(IMG_INIT_TIF) == 0)
	{
		std::cout << "Failed to initialize SDL_Image. " << IMG_GetError() << std::endl;
		Logger("Failed to initialize SDL_Image.");
		return false;
	}
	else
		Logger("Success to initialize SDL_Image.");
	if (SDL_SetHint(SDL_HINT_RENDER_SCALE_QUALITY, "1") == SDL_FALSE)
	{
		std::cout << "Failed to set the render scale quality. " << SDL_GetError() << std::endl;
		Logger("Failed to set the render scale quality.");
	}
	else
		Logger("Success to set the render scale quality.");
	pWindow = SDL_CreateWindow("IMGprocessor", WindowStartPosInSecondScreen, WindowsStartYposInSecondScreen, WindowWidth, WindowHeight, SDL_WINDOW_BORDERLESS);
	if (!pWindow)
	{
		std::cout << "Failed to create the SDL window. " << SDL_GetError() << std::endl;
		Logger("Failed to create the SDL window.");
		return false;
	}
	else
		Logger("Success to create the SDL window.");
	pRenderer = SDL_CreateRenderer(pWindow, -1, SDL_RENDERER_ACCELERATED);
	if (!pRenderer)
	{
		std::cout << "Failed to create the SDL renderer. " << SDL_GetError() << std::endl;
		Logger("Failed to create the SDL renderer.");
		return false;
	}
	else
		Logger("Success to create the SDL renderer.");
	if (SDL_SetRenderDrawColor(pRenderer, 0, 0, 0, 0xFF) == -1)
	{
		std::cout << "Failed to set the SDL render draw color. " << SDL_GetError() << std::endl;
		Logger("Failed to set the SDL render draw color.");
	}
	else
		Logger("Success to set the SDL render draw color.");
	return true;
}
void DeinitializeSDL()
{
	if (pRenderer)
	{
		SDL_DestroyRenderer(pRenderer);
		pRenderer = nullptr;
	}
	if (pWindow)
	{
		SDL_DestroyWindow(pWindow);
		pWindow = nullptr;
	}
	IMG_Quit();
	SDL_Quit();
}
bool Create(void)
{
	const unsigned long maxDir = 260;
	char currentDir[maxDir];
	GetCurrentDirectory(maxDir, currentDir);
	for (int i = 0; i < numSection; i++)
	{
		char fileName[50] = "temp\\crop_";
		string s = std::to_string(i);
		const char *cstr = s.c_str();
		strcat_s(fileName, sizeof fileName, cstr);
		strcat_s(fileName, sizeof fileName, ".tif");
		BackgroundTexture[i].pTexture = CreateTexture(fileName);
	}
	for (int i = 0; i < numSection; i++)
	{
		if (!BackgroundTexture[i].pTexture)
		{
			Logger("Image Loading failed in texture");
			return false;
		}
		else
			Logger("Image Loading success in texture");
	}
	int TextureWidth = 0;
	int TextureHeight = 0;
	SDL_QueryTexture(BackgroundTexture[0].pTexture, nullptr, nullptr, &TextureWidth, &TextureHeight);
	for (int i = 0; i < numSection; i++)
	{
		BackgroundTexture[i].Quad = { TextureWidth * i, 0, TextureWidth, TextureHeight };
	}
	Camera.Quad = { 0, 0, WindowWidth, WindowHeight };
	return true;
}
void Destroy(void)
{
	for (int i = 0; i < numSection; ++i)
	{
		if (BackgroundTexture[i].pTexture)
		{
			SDL_DestroyTexture(BackgroundTexture[i].pTexture);
			BackgroundTexture[i].pTexture = nullptr;
		}
	}
}
void HandleEvents(void)
{
	while (SDL_PollEvent(&Event))
	{
		if (Camera.State == CAMERA_STILL)
		{
		}
		if (startFlag == 0)
		{
			ofstream dl("dd.txt");
			dl << "1";
			Sleep(delayTimer);
			startFlag = 1;
			break;
		}
		if (startFlag == 1)
		{
			Player.State = PLAYER_MOVING_RIGHT;
			startFlag = 2;
			break;
		}
		switch (Event.type)
		{
			case SDL_KEYDOWN:
			{
				switch (Event.key.keysym.sym)
				{
					case SDLK_ESCAPE:
					{
						Running = false;
						Camera.State = CAMERA_STILL;
						break;
					}
				}
			}
		}
	}
}
void Update(void)
{
	HandleEvents();
	NewTime = SDL_GetTicks();
	DeltaTime = (NewTime - OldTime) / 1000.0;
	OldTime = NewTime;
	if (Player.State != PLAYER_STILL)
	{
		Player.XPosition += (Player.State == PLAYER_MOVING_LEFT ? -Player.Velocity : Player.Velocity) * (float)DeltaTime;
		if (Player.XPosition <= (Camera.XPosition + DistanceToWindowEdge))
		{
			if (Camera.XPosition > levelWidth)
			{
				Camera.State = CAMERA_STILL;
				Logger("Finished Odd row Auto scrolling ");
				Running = false;
				return;
			}
			if (Camera.XPosition > 0.0f)
			{
				Player.XPosition = Camera.XPosition + DistanceToWindowEdge;
				Player.PrevXPosition = Player.XPosition;
			}
		}
		else if (Player.XPosition + Player.Width > (Camera.XPosition + WindowWidth) - DistanceToWindowEdge)
		{
			if (Camera.XPosition < (levelWidth - WindowWidth))
			{
				Camera.State = CAMERA_SCROLLING_RIGHT;
				Player.XPosition = (Camera.XPosition + sectionWidth) - Player.Width - DistanceToWindowEdge;
				Player.PrevXPosition = Player.XPosition;
			}
		}
		if (Player.XPosition < 0.0f)
			Player.XPosition = 0.0f;
		else if (Player.XPosition > levelWidth - Player.Width)
			Player.XPosition = levelWidth - Player.Width;
	}
	if (Camera.State != CAMERA_STILL)
	{
		const bool ScrollingLeft = (Camera.State == CAMERA_SCROLLING_LEFT);
		Player.XPosition += (ScrollingLeft ? -(Camera.Velocity * 0.25f) : (Camera.Velocity * 0.25f)) * (float)DeltaTime;
		Camera.XPosition += ((ScrollingLeft ? -Camera.Velocity : Camera.Velocity) * (float)DeltaTime);
		const float Distance = (ScrollingLeft ? (Camera.PrevXPosition - Camera.XPosition) : (Camera.XPosition - Camera.PrevXPosition));
		if (Distance >= sectionWidth)
		{
			const float FinalCameraPosition = (ScrollingLeft ? (Camera.PrevXPosition - sectionWidth) : (Camera.PrevXPosition + sectionWidth));
			Camera.XPosition = FinalCameraPosition;
			Camera.PrevXPosition = FinalCameraPosition;
		}
	}
	if (Player.State != PLAYER_STILL)
	{
		if (Camera.XPosition < (levelWidth - WindowWidth))
		{
			Camera.State = CAMERA_SCROLLING_RIGHT;
			Player.XPosition = (Camera.XPosition + sectionWidth) - Player.Width - DistanceToWindowEdge;
			Player.PrevXPosition = Player.XPosition;
		}
	}
}
void UpdateEvenRow(void)
{
	HandleEvents();
	NewTime = SDL_GetTicks();
	DeltaTime = (NewTime - OldTime) / 1000.0;
	OldTime = NewTime;
	if (Player.State != PLAYER_STILL)
	{
		Player.XPosition += (Player.State == PLAYER_MOVING_LEFT ? -Player.Velocity : Player.Velocity) * (float)DeltaTime;
		if (Player.XPosition <= (Camera.XPosition + DistanceToWindowEdge))
		{
			if (Camera.XPosition > 0.0f)
			{
				Camera.State = CAMERA_SCROLLING_LEFT;
				Player.XPosition = Camera.XPosition + DistanceToWindowEdge;
				Player.PrevXPosition = Player.XPosition;
			}
		}
		else if (Player.XPosition + Player.Width > (Camera.XPosition + WindowWidth) - DistanceToWindowEdge)
		{
			if (Camera.XPosition < (levelWidth - WindowWidth))
			{
				Player.XPosition = (Camera.XPosition + sectionWidth) - Player.Width - DistanceToWindowEdge;
				Player.PrevXPosition = Player.XPosition;
			}
		}
		if (Player.XPosition < 0.0f)
			Player.XPosition = 0.0f;
		else if (Player.XPosition > levelWidth - Player.Width)
			Player.XPosition = levelWidth - Player.Width;
	}
	if (Camera.State != CAMERA_STILL)
	{
		if (Camera.XPosition <= cameraStartPosition)
		{
			Camera.State = CAMERA_STILL;
			Logger("Finished even row Auto scrolling ");
			Running = false;
			return;
		}
		const bool ScrollingLeft = (Camera.State == CAMERA_SCROLLING_LEFT);
		Player.XPosition += (ScrollingLeft ? -(Camera.Velocity * 0.25f) : (Camera.Velocity * 0.25f)) * (float)DeltaTime;
		Camera.XPosition += ((ScrollingLeft ? -Camera.Velocity : Camera.Velocity) * (float)DeltaTime);
		const float Distance = (ScrollingLeft ? (Camera.PrevXPosition - Camera.XPosition) : (Camera.XPosition - Camera.PrevXPosition));
		if (Distance >= sectionWidth)
		{
			const float FinalCameraPosition = (ScrollingLeft ? (Camera.PrevXPosition - sectionWidth) : (Camera.PrevXPosition + sectionWidth));
			Camera.XPosition = FinalCameraPosition;
			Camera.PrevXPosition = FinalCameraPosition;
		}
	}
	if (Player.State != PLAYER_STILL)
	{
		if (Camera.XPosition < (levelWidth - WindowWidth))
		{
			Camera.State = CAMERA_SCROLLING_LEFT;
			Player.XPosition = (Camera.XPosition + sectionWidth) - Player.Width - DistanceToWindowEdge;
			Player.PrevXPosition = Player.XPosition;
		}
	}
}
void Render(void)
{
	SDL_RenderClear(pRenderer);
	for (int i = 0; i < numSection; ++i)
	{
		if (BackgroundTexture[i].pTexture)
		{
			const SDL_Rect TextureQuad = { BackgroundTexture[i].Quad.x - (int)Camera.XPosition,
				BackgroundTexture[i].Quad.y,
				BackgroundTexture[i].Quad.w,
				BackgroundTexture[i].Quad.h };
			if (!QuadVsQuad(Camera.Quad, TextureQuad))
				continue;
			SDL_RenderCopy(pRenderer, BackgroundTexture[i].pTexture, nullptr, &TextureQuad);
		}
	}
	SDL_SetRenderDrawColor(pRenderer, 0, 0, 0, SDL_ALPHA_OPAQUE);
	SDL_SetRenderDrawColor(pRenderer, 0, 0, 0, SDL_ALPHA_OPAQUE);
	SDL_RenderPresent(pRenderer);
}
int main(int argc, char *argv[])
{
	numSection = atoi(argv[2]);
	balanceWidth = atoi(argv[3]);
	sectionWidth = 540;
	levelWidth = sectionWidth * numSection + balanceWidth;
	BackgroundTexture = new STexture[numSection];
	Camera.Velocity = atof(argv[1]);
	Camera.XPosition = atof(argv[4]);
	Camera.PrevXPosition = Camera.XPosition;
	cameraStartPosition = atoi(argv[4]);
	oddEvenRow = atoi(argv[5]);
	WindowWidth = atoi(argv[6]);
	WindowHeight = atoi(argv[7]);
	WindowStartPosInSecondScreen = atoi(argv[8]);
	WindowsStartYposInSecondScreen = atoi(argv[9]);
	delayTimer = atoi(argv[10]);
	if (InitializeSDL())
	{
		if (Create())
		{
			while (Running)
			{
				if (oddEvenRow == 1)
				{
					Update();
				}
				if (oddEvenRow == 2)
				{
					UpdateEvenRow();
				}
				Render();
				SDL_Delay(1);
			}
			Logger("Destroy all created data");
			Destroy();
		}
		Logger("Destroy SDL, the SDL window and the SDL renderer");
		DeinitializeSDL();
	}
	return 0;
}
bool checkFileProcess()
{
	if (FILE *file = fopen("process.txt", "r")) {
		fclose(file);
		return true;
	}
	else
	{
		return false;
	}
}
bool checkFileReady()
{
	if (FILE *file = fopen("ready.txt", "r")) {
		fclose(file);
		return true;
	}
	else
	{
		return false;
	}
}
bool checkFileSDL()
{
	if (FILE *file = fopen("sdl.txt", "r")) {
		fclose(file);
		return true;
	}
	else
	{
		return false;
	}
}
string getCurrentDateTime(string s)
{
	time_t now = time(0);
	struct tm  tstruct;
	char  buf[80];
	tstruct = *localtime(&now);
	if (s == "now")
		strftime(buf, sizeof(buf), "%H-%M-%S", &tstruct);
	else if (s == "date")
		strftime(buf, sizeof(buf), "%Y-%m-%d", &tstruct);
	return string(buf);
}
void Logger(string logMsg)
{
	string filePath = "Log/log_" + getCurrentDateTime("date") + "_" + getCurrentDateTime("now") + ".txt";
	string now = getCurrentDateTime("now");
	ofstream ofs(filePath.c_str(), std::ios_base::out | std::ios_base::app);
	ofs << now << '\t' << logMsg << '\n';
	ofs.close();
}
Kindly help me to based o CPU profile and SDL source code.
How can i load (preloading) the full image in RAM.
Many Thanks.
HI
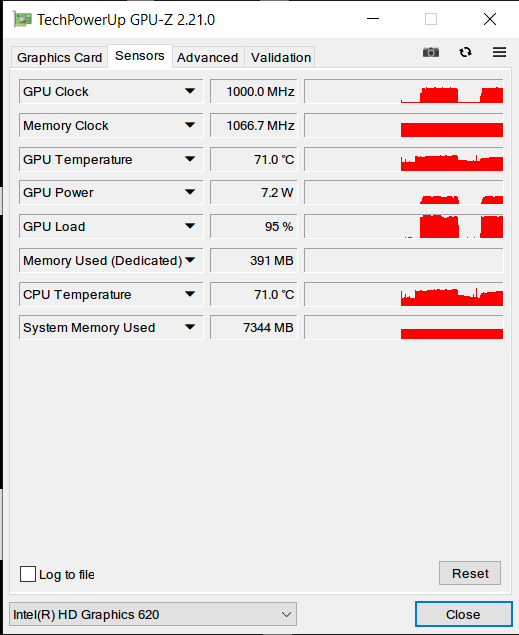
I can’t attached 2 images in single thread. they are not allowing. here i am attaching the GPU usage while running application.
Kindly check my source and CPU and GPU profiler and help me to fix the issue to make very smooth scroll and consistent performance.
Many Thanks.
You misunderstood how to post code blocks. Apparently my description was lacking. Check this out:
I fixed your code block for you.
Many Thanks.
KIndly do the needful. Looking forward solution from you.
HI
Do you have any update for me? Any solution its in SDL or openGL.
When i scroll the image 100 velocity - its working fine - Consistent image scrolling.
When i scroll the velocity 300 or above - Inconsistent Image scrolling.
Looking forward it. I am using Tif images.
Many Thanks.
Have you run a CPU profiler on your application yet? What bottlenecks did you find?
Hello Photon
And many thanks for the revert. Appreciate your patience and time.
I did run CPU profiler on visual studio 2015 along with CPU and GPU usage
GPU (2gb memory Nvidia Ge-Force GT710) is using 99.9% of memory both at 400 and 100 pixel per second velocity. However results at 100 pixels speed is near perfect but becomes inconsistent on higher speeds.
CPU memory usage remains almost constant at around 50% during the whole operation. No major bottlenecks found when compared at different pixel speeds, but at higher speed scrolling tends to stutter at times or could be more visible at higher speed. Can you please have a look at our codes and see if you can find something.
Also, since this is my first project on sdl, I am not quiet sure either about preloading or paging of images. Currently I have simply tried using cropping to 540 x 1080 pixels and tiling of large tiff file based on inputs received from sdl forums, cant really say what is going-on underneath the specific functions.
Looking forward for your help. I am stuck on this since past 2-3 weeks and well passed deadline and in very bad shape as well.
if you want i can share the report in diagsession format.
Looking forward your reply. Many Thanks.
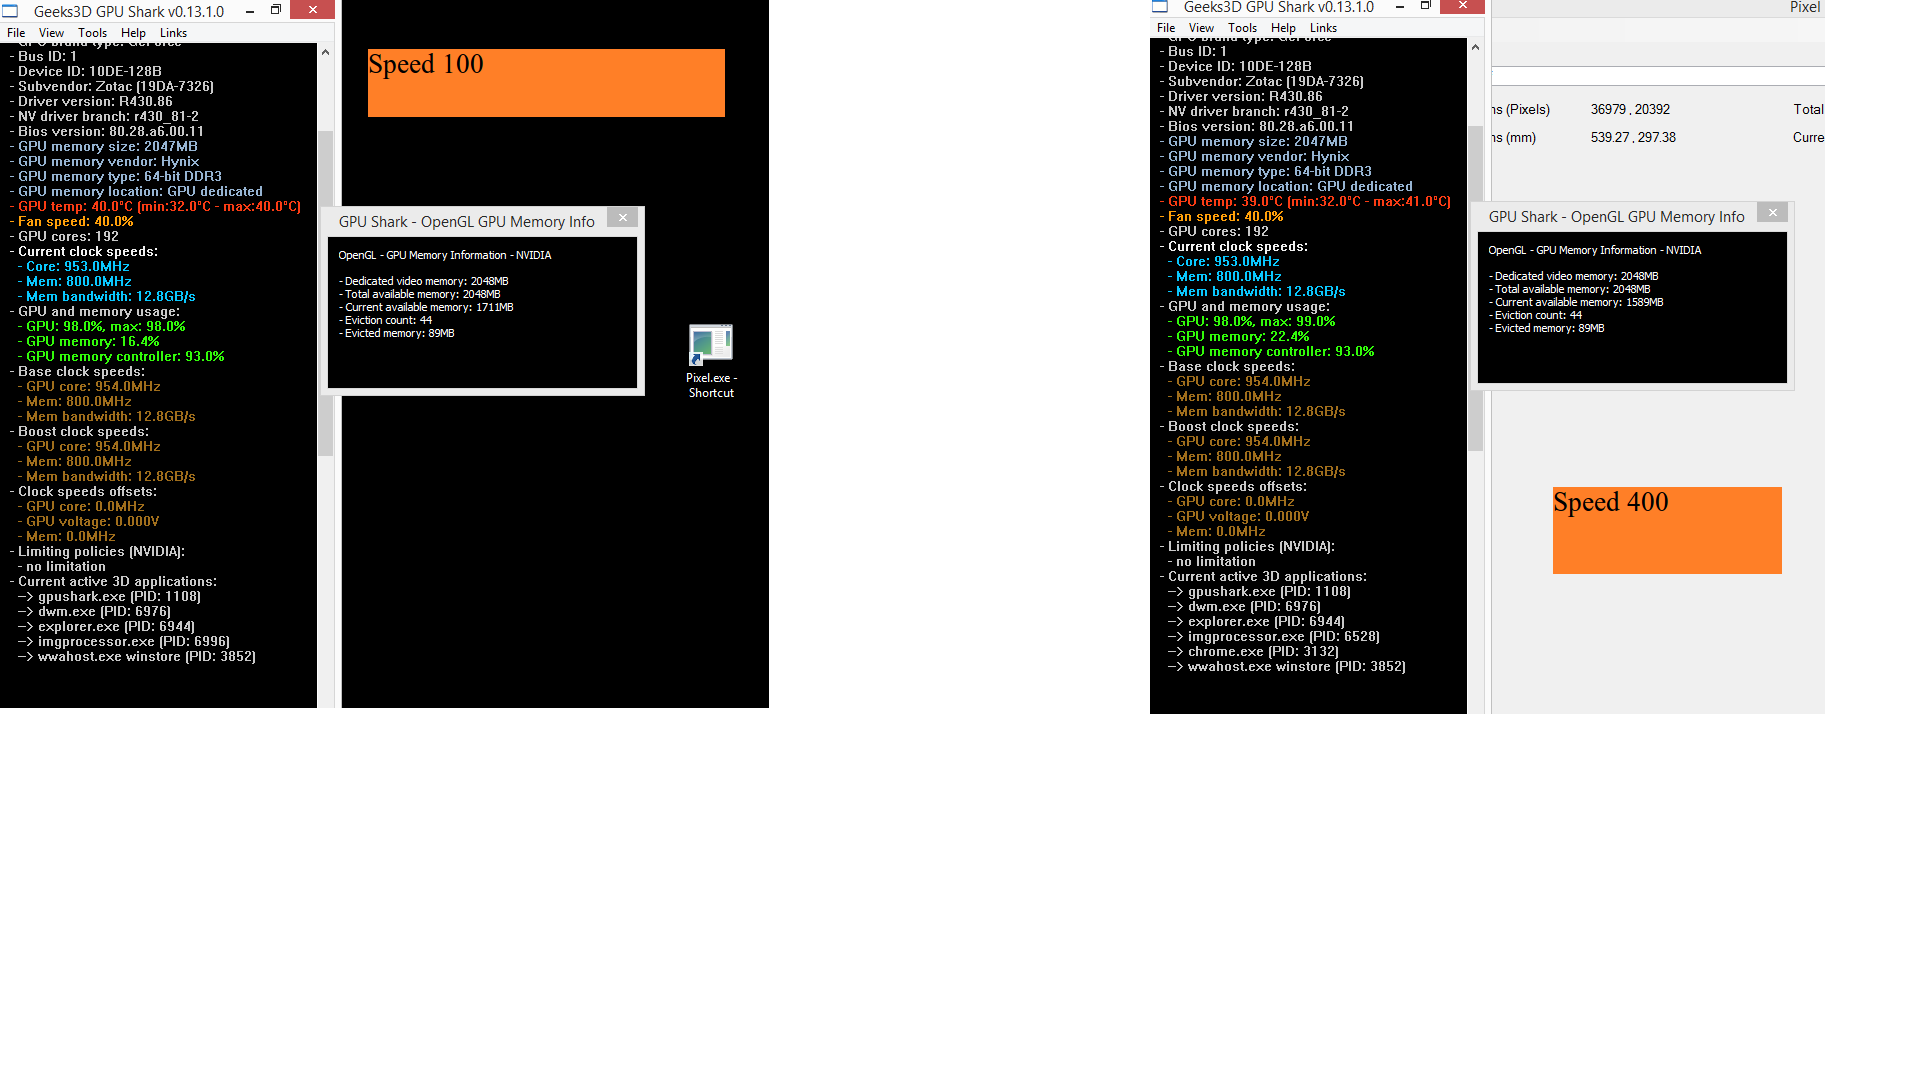
Does GPU Shark report that you are evicting GPU memory. That is, under Tools → NVidia - GPU Memory Info, is the “Eviction count” or the amount of “Evicted memory” increasing at any time after starting your application.
If so, you’re overrunning GPU memory. This has very bad performance implications. When the driver runs out of GPU memory, your app stalls for a while in some random GL API call while the driver shuffles data off the GPU to make room for new data that your app (or some other app utilizing the GPU) has asked it to load.
HI
Thanks for your response.
Here i am attaching the GPU shark screen shot while doing image scrolling 100 speed and 400 speed.
GPU shark - Image Scrolling with Speed 100 and Speed 400
Check the screen shot and update me for the solution. Many Thanks.
Appreciated your help.
Hi
@Dark_Photon
Any update on this? We have tried New PC with 2GB graphics card and run the application, still i am getting same GPU usage attached previous reply.
Looking forward your help and much appreciated.
Many Thanks
No, no updates. You’re on your own with diagnosing this one. I’ve just provided you a few tips to help get you started in isolating the bottleneck(s). And so far I haven’t seen any smoking guns in what you posted (I’m not going to sift, profile, and fix your code for you though).
You obviously brought up a profiler on this, but didn’t expand the bullets where most of the CPU time is being spent. You also brought up GPU Shark, but didn’t say whether or not the “Evicted” numbers are changing at any time after you started your app.
As I said before, the first step is to determine where your program is spending most of its time. Then you can determine what you can do about it. Good luck! You can do this!