I have a dataset obtained from astronomical simulation. This data was created in a curvilinear grid with polar coordinates.
The form of this dataset is a simple array (1d) of intensities, i can visualize this data in python whit the next code.
densINcgs = 8888035.76
Munit = 1.0 #solar mass
Runit = 1.0 #au
DensUnit = Munit / Runit**2.0 * densINcgs # grams / (cm^2)
# grid specification
nrad = 128 #128 #500
nsec = 384 # 256 #1500
Rmin = 0.4
Rmax = 1.8
r = np.linspace(Rmin, Rmax, nrad)
print("rx: ",np.linspace(179517444792000.0,897587223960000.2,384))
rr = []
for i in range(0,nrad):
rr.append(Rmin*exp(i*log(Rmax/Rmin)/nrad))
print("rr",rr)
print("lin",np.linspace(0.,2.*np.pi, nsec))
theta, rad = np.meshgrid(np.linspace(0., 2.*np.pi, nsec), rr)
xi = rad * np.cos(theta)
yi = rad * np.sin(theta)
#READ DATA
rho = fromfile("dens10.dat",dtype='float32')
Rho = rho.reshape(nrad,nsec)
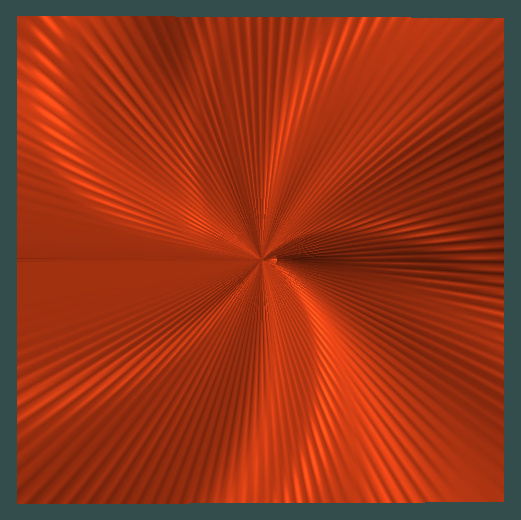
#FIRST IMAGE
figure(100)
imshow(log10(Rho*DensUnit),origin='lower',
cmap=cm.Oranges_r,aspect='auto')
xlabel('x [AU]', fontsize=16)
ylabel('y [AU]', fontsize=16)
cb = plt.colorbar()
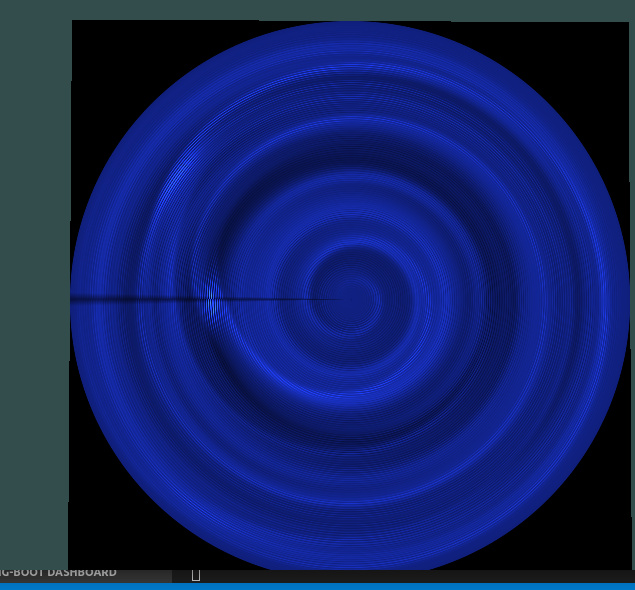
#SECON iMAGE
cb.set_label('log Density [$\\rm g$ $\\rm cm^{-2}$]')
zc = np.linspace(0, 255, 49152).reshape(128, 384)
zc=np.random.rand(49152)*10
zc= zc.reshape(128, 384)
figure(17)How visualize a data generate in curvilinear grid in opengl
pcolormesh(xi,yi,log10(Rho*DensUnit))
show()
First:
[
Second:

The first image is the direct visualization of the data, and the second image is ta correct visualization of the data on a curvilinear grid. I generated this visualization with pcolormesh.
But i want generate the second visualization with openGL and glsl, using texture mapping. i tried this with the next code ( a part).
Load textures
I define a quad with this vertices.
float vertices[] = {
-0.5f, -0.5f, -0.5f,  0.0f, 0.0f,
0.5f, -0.5f, -0.5f,  1.0f, 0.0f,
0.5f,  0.5f, -0.5f,  1.0f, 1.0f,
0.5f,  0.5f, -0.5f,  1.0f, 1.0f,
-0.5f,  0.5f, -0.5f,  0.0f, 1.0f,
-0.5f, -0.5f, -0.5f, 0.0f, 0.0f
}
i load the data set ( x=128 , y=384 )
float *pData = new   float[XDIM * YDIM];
FILE *archivo;
archivo = fopen("dens10.dat", "rb");
//  archivo=fopen("avance/media/data5.out","rb");
std::cout << "A3" << std::endl;
if (archivo != NULL){
 std::cout << "A3.1" << std::endl;
}
for (int i = 0; i < XDIM * YDIM ; i++)
{   //std::cout << "A3.5" << std::endl;
float v;
fread((void*)(&v), sizeof(v), 1, archivo);
pData[i]=v;
}
and i define te textures
glGenTextures(1, &texture1);
glBindTexture(GL_TEXTURE_2D, texture1);
// set the texture wrapping parameters
glTexParameteri(GL_TEXTURE_2D, GL_TEXTURE_WRAP_S, GL_CLAMP_TO_BORDER);
glTexParameteri(GL_TEXTURE_2D, GL_TEXTURE_WRAP_T, GL_CLAMP_TO_BORDER);
// set texture filtering parameters
glTexParameteri(GL_TEXTURE_2D, GL_TEXTURE_MIN_FILTER,        GL_LINEAR_ATTENUATION);
glTexParameteri(GL_TEXTURE_2D, GL_TEXTURE_MAG_FILTER,    GL_LINEAR_ATTENUATION);
vertex shader
#version 330 core
layout (location = 0) in vec3 aPos;
layout (location = 1) in vec2 aTexCoord;

out vec2 TexCoord;

uniform mat4 model;
uniform mat4 view;
uniform mat4 projection;

void main()
{

vec4 cord = projection * view * model * vec4(aPos, 1.0f);

gl_Position = vec4(cord);

TexCoord=aPos.xy;
}
fragment shader
#version 330 core
out vec4 FragColor;

in vec2 TexCoord;

// texture samplers
uniform sampler2D texture1;
// uniform sampler2D texture2;

#define PI 3.14159265358979323844


void main()
{

	float c=texture(texture1,TexCoord ).r;
	// vec4 col=vec4(10000*c,30*c,20*c,1.0);
	vec4 col=vec4(c*1000,300*c,100*c,1.0);

	FragColor = col;
}
The result is the next.
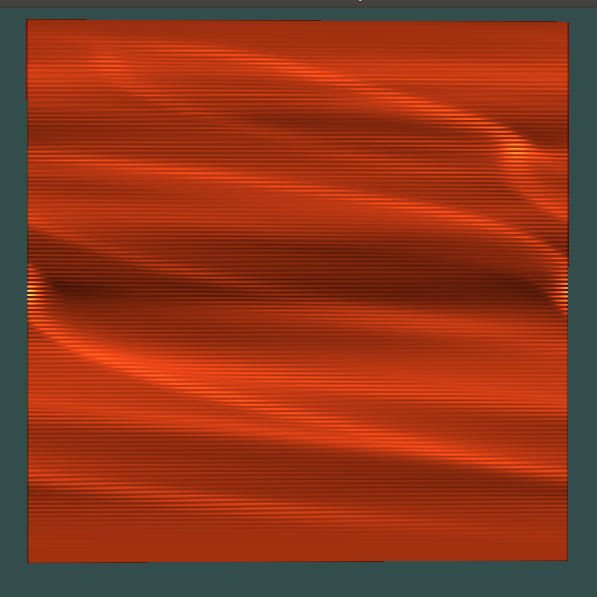
As can be seen this image is very similar to firt image obtained in python but my intention is get a image similary to the second.
This is the dataset
[data set] (https://drive.google.com/file/d/14C02cVNkwWMbrG9DAjC05y8YAfCUUAOJ/view?usp=sharing)!
Thank you very much in advance.