I’m working on open world engine which supports huge locations.
Some time ago I implemented occlusion culling (that includes frustum culling) using HighZ map and octree.
It gave to me very good performance bust.
For development I’m using locations I get from stalker game.
Now my engine is a quite simple: it just support static stuff and ‘sunlight cascade shading’.
That is almost all.
So such simple engine let me reach a cost of the frame about 40-50ms (19-35 fps: depends on a sunlight angle and camera position and direction)
This is not enough.
Now I’m thinking for possible improvements.
Could you help me form a list with possible common optimizations sorted by an efficiency.
You need to identify where the bottlenecks actually are in your particular application. Disable parts of the rendering process (or reduce their overhead), and note the effect upon overall performance. Texture memory bandwidth can be reduced by using use lower-resolution mipmap levels via either the bias parameter to the texture function or the GL_TEXTURE_LOD_BIAS texture parameter.
If your system supports it, look at GPU utilisation. If your application isn’t close to 100% GPU utilisation, that suggests pipeline stalls are an issue (or your application is CPU-bound rather than GPU-bound, in which case optimising the GPU side won’t help).
Consider instrumenting the code with timer queries to see which rendering processes are taking the most time (but don’t create pipeline stalls when reading the result; use GL_QUERY_RESULT_AVAILABLE to check).
Profile your engine and determine the biggest bottleneck. Optimize that. Rinse/repeat until fast enough.
Sounds simple enough, right? Often it means adding more switches to your app so you can quickly determine what part of your frame processing is the primary driver of your frame time. Then you can determine why. Too many state changes and tiny batches/draw calls? Too much fill? Too much needless work being done? Inefficient CPU->GPU transfers? etc.
Profiling your app (or even just capturing and viewing your frames) in a GL call trace-based tool like Nsight Graphics can point out inefficiencies in your GL call stream that you weren’t aware of. For other related tools, see Debugging Tools in the OpenGL wiki.
But now I can say that with disabled DL shading most of all time eats rasterization of complicated objects.
When It hidden from screen space point of view the preformance is much better.
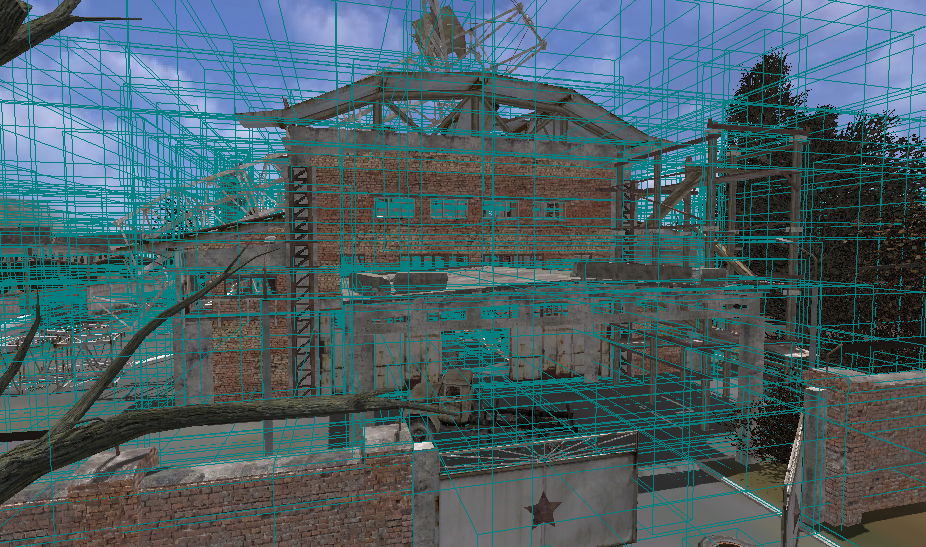
There is complicated building. The lines - bounding boxes of objects.
So, too many objects kill whole performance.
But in the original game, that have much more effects (huge pack of shaders) such place eats around 11-13ms (if I correct calculated it: 70 - 80FPS) in the same hardware.
That is why I think about LOD improvement.
PS: all objects on the level is unique, thus I also have many calls to render it.
That suggests that you’re fragment limited. With typical usage, the pipeline can’t cull away hidden primitives and fragments until the vertex shader has at least transformed them into screen space.
Try reducing your fragment load by reducing your window resolution while keeping your camera field-of-view the same. Do you see a similar reduction in your frame time? If so, that’s further evidence that you may be fragment limited.
Those are individual objects, each with their own exterior faces? If so, that’s going to generate a lot of overlapping fill (potential fragment work).
At minimum, render geometry front-to-back (as GClements suggested) with depth test+writes to get the best fill savings you can with the batches you have (this so that the pipeline can kill off faces and fragments known to be hidden by already-rasterized geometry in the Z-buffer prior to rasterization). Also, avoid pipeline state that would prevent use of efficient Z culling in the pipeline (e.g. avoid alpha test, discard, writing fragment depth, alpha-to-coverage, changing depth function, etc.).
However, strongly consider improving on that by generating a simplified geometry representation that doesn’t even pass occluded geometry down the pipeline in the first place. With that, you can save not only on the needless fill (and special optimizations to avoid it) but also all of the needless vertex transforms and draw calls that you’re otherwise using to render internal, mostly-occluded geometry.
“Huge pack of shaders” tends to suggest lots of state changes and draw calls needed to render your scene, which may shift your bottleneck from being fragment limited to CPU . You might check that at some point.
That’s not a given. If you can coax your objects to render many of your scene objects using a single shader or small set of shaders rather than a bunch of different shaders, you could in theory render your entire scene in a few draw calls (the number tuned for culling efficiency). In the limit, you could render your entire scene using one shader and one draw call, but you don’t need to go to that extreme.
No.
I read about ‘early depth test’ before.
It means I should prepare depth map (without fragment shader and diabled color writing) in first pass and then using it render color part (use fragment shader with disabled depth writing) of scene in the second one.
Am I right?
Just Directional Light cascaded shadow generation.
Using a ‘hidden’ word I meant culled objects by implemented ‘occlusion culling’ technique.
Those objects is not be sending to render process at all.
I have two different GPU to test it.
using integrated IntelHD: frame time depends on resolution very good.
on discrete Radeon R9: frame time is not depends on resolution even using 4K. But it also have low frame rate on complicated objects as well.
So, what the best solution is:
sorting front-to-back + ‘early depth test’?
just ‘early depth test’ (does it let avoid sorting of objects)?
just sorting front-to-back?
I’m using the discarding in the fragment shader, because not all objects are opaque.
So, I have to use discarding or alpha-to-coverage.
But I can render separately opaque objects and transparent ones.
The question is: If I encapsulate discarding under subroutine for transparent objects it increase efficient for opaque branch?
I meant there are much effects, such as water surface with waves, air distortions, rain drops on the helmet, different sort os particles. As I know it all effects calculated in different shaders.
I understood.
But how can I do that?
Each object have it own texture and Normal map.
As minimum I must bind correct textures for every object (it is two calls per object).
How can I avoid it?
So, as general case I see next points:
avoid rasterization of invisible fragments (the question - which way: frot-to-back + ‘early depth test’, just ‘early depth test’ or just front-toback - is still open)
avoid pipeline states of inefficient Z culling when it possible (this moment also isn’t completely clear)
That’s one way to do it. Or you can just render approximately from front to back. The general idea is that you want occluded fragments to fail the depth test (because whatever is in front has already been rendered into the depth buffer), rather than being rendered then overwritten.
The early depth test optimisation is applied automatically if the implementation can determine it doesn’t affect the result. This means ensuring that the fragment shader doesn’t use discard statements, write to gl_FragDepth, or having other side effects (image load/store, atomics, etc). Alternatively, you can forcibly enable the optimisation by adding layout(early_fragment_tests); to the fragment shader. In that case, the depth test is always performed prior to the fragment shader being executed. If the fragment shader is executed, writes to gl_FragDepth are ignored and the depth buffer is always updated with the interpolated depth even if the fragment shader executes a discard statement.
To get the benefit of early depth testing, you need to ensure that occluded fragments (usually) fail the depth test. Rendering from front to back does this (the occluding surface will be rendered first, so the depth buffer will contain the depth value when the occluded surface is rendered). Another option is rendering the scene into the depth buffer in a pre-pass. In that case, you can either render everything accurately (not including objects with alpha-tested or alpha-blended textures) and don’t bother writing the depth buffer in the main rendering stage, or render only the major occluders (skipping objects like railings or wires which won’t occlude much) possibly using simplified geometry.
Either way, discarding occluded fragments via the depth test is much cheaper than rendering them then overdrawing. If a fragment fails the depth test, the fragment shader doesn’t need to be executed, projective division (division by W) doesn’t need to be performed, textures don’t need to be sampled, etc.
Non-opaque objects need to be handled separately. If you’re rendering them with depth writes enabled, you need a fragment shader which discards transparent fragments, which precludes using early fragment tests. If you’ve done a depth pre-pass and are rendering with depth writes disabled, you can force early fragment tests on via the layout qualifier.
If textures are the same size and format and use the same texture parameters (i.e. filter and wrap modes), you can combine them into a texture array. This lets you effectively have multiple textures in a single texture unit, avoiding the need to rebind . The layer is selected in the fragment shader using the third texture coordinate (which is unnormalised).
GClements has already given you some good feedback. So I’ll just add to that.
That’s called a “depth pre-pass”, not “early depth test”.
“Early depth test” refers to capability built into the GL driver to discard fragments and even whole primitives before the fragment shader for a fragment has been executed. If you follow certain rules, you can make the best use of this.
You don’t need a “depth pre-pass” to make use of “early depth tests”.
Ok. So we’re talking about the case with Cascaded Shadow Map generation and application disabled.
Oh. Well then that doesn’t necessarily point the finger at a fragment bottleneck. It could be, but could just as well be a vertex, draw call, or state change/CPU bottleneck.
Ok, so apparently not fragment limited on the AMD.
You’ve just indicated that you’re not fragment limited on the AMD GPU. So this list geared toward saving fill probably won’t help you there. You’re back to looking for the primary bottleneck, on the AMD GPU at least.
Again, this line of thinking was based on the theory that you might be fragment limited. On the AMD GPU, you’re not apparently (at least in the test case exercised).
However, if you were, then I’d suggest you first get rid of any needless layers of fill you can (interior faces, etc.). Then rasterize 100% opaque objects using a shader and state that maximizes you early Z culling benefit (e.g. no discard, alpha test, etc. and either rough front-to-back draw order or depth pre-pass). Once you’ve got the depth buffer seeded with that, go back and blend on translucents (with alpha test, blend, alpha-to-coverage, whatever). After the opaque pass, you’ll at least have a very conservative depth buffer that should kill off most/all of the occluded translucent stuff.
You just pass 64-bit texture handles into your shader and then use them to sample your textures. With this, you can toss the old concept of binding textures in the trash can. No more need to break a batch (that is, split geometry into multiple draw calls) just to change textures!
On NVidia GPUs, you can pass in these 64-bit texture handles pretty well any way you want.
However, on many other vendor’s GPUs you need to pay close attention to the comment on the above wiki page link about Dynamically Uniform Expressions. This limits the types of expressions you can use to come up with these 64-bit texture handles. Using gl_DrawID in the shader underneath a glMultiDraw*Indirect() draw call qualifies as dynamically uniform. So you could for instance (on any GPU supporting bindless texture) have every sub-draw in a glMultiDraw*Indirect() draw call fetch from its own, distinct set of textures, letting you render multiple objects referencing different textures in the same draw call so long as they can be rendered with the same shader.
Texture arrays (as GClements) mentions are also an option. But I’d view them as a 2nd class solution compared to bindless textures.
Take a look at both options though, particularly if you determine that you are batch or texture state change limited.
No. With AMD you’re back to figuring out what the primary bottleneck is. Once you know that, then consider possible solutions for that bottleneck.
What must be happened for discarding whole primitive?
I mean I can’t imagine a case when it possible.
Even if all vertices of a triangle is located behind the depth map of screen, some area of the triangle may be visible.
This has been around for a long while, so there should be plenty of good info out there on it.
Just to briefly back up and clarify: There are basically two different types of “early depth test”. The first is performed per-fragment as you’d expect at the resolution of the depth buffer. Call this “fine-grained Z” or “early Z”. It just performs the usual depth test before the fragment shader for a fragment has executed, because it knows the fragment shader won’t change the depth value (in the typical case).
Then even further back in the pipeline there’s the “early depth test” that discards whole primitives (or whole pixel tiles covered by part of primitives). Call this “course-grained Z”. This makes use of a “conservative depth” buffer stored at a lower resolution than per-pixel (or per-sample), possibly with multiple hierarchical levels. 10+ years ago, NVidia called their scheme ZCULL and ATI/AMD called theirs Hi-Z (aka Hierarchical Z), IIRC. Basically, this course-grained Z buffer stores the “worst case” depth for a multi-pixel region. The pipeline then compares the “worst case” depth across the primitive to values in this buffer. If the comparison says that even in the worst case, no fragments from the primitive will make it to the framebuffer, then the pipeline can kill off the whole pixel tile. That might cover the whole primitive, in which case the whole primitive is rejected.
May be that is the reason why I hadn’t get performance increation when I forced ‘early depth testing’ using instruction ‘layout(early_fragment_tests)’ in FS.
Actually I received unrendered objects those were located behind transparent objects but not the performance.
Also I realized that rasterization is not bottleneck at all.
I disabled rasterization, just stopped use FS.
And as result I have ‘frame time’ decreased from 37.4 ms to 34 ms (FPS: 27.3 -> 29).
Thus, I know the rasterization doesn’t need to be optimized.
Another point: Sun shadow generation also not bottleneck, disabling does not get any sensible speedup.
So, I have to only one part of engine to work on: ‘Culling part’.
Good info. So now the question is, where’s that other 34 msec coming from.
Also, for thread clarity, I’ve got a few question:
Which GPU is this? (Based on the above, I’m presuming the Radeon R9)
Which driver? (i.e. what’s your GL_RENDERER and GL_VERSION string)?
Exactly how did you stop using fragment shading?
Ok. You’d already disabled sun shadow map application by disabling fragment shading when rendering the scene above. So this also disabled the sun shadow map generation as well. I’m a little surprised you don’t see any significant speedup. But OK.
You’ve already indicated above that you’re not fragment bound on the GPU. The next thing I would look at is whether you may be vertex bound on the GPU. Try cutting the number of vertices you send down the pipe by 2X and 4X, while keeping the batch count (number of draw calls) and state changes constant and see what effect that has on your frame time.
That’s not the only part. That’s one of the pieces on the CPU side, sure. But there’s also looking at whether you are CPU bottlenecked for other reasons. For instance, by submitting too many state changes or too many draw calls to the driver. To get some insight into those, try:
rendering all of your batches within a single pass using the same simple shader program and GL state (i.e. remove all of the state changes between your draw calls), or
cutting the number of draw calls you issue by 1/2 while trying to keep the number of vertices and primitives you’re sending down the pipe constant, or
tallying the number of draw calls and the number of state change groups you’ve got (particularly expensive state changes like render target binds and shader program changes).
I’ll also throw out there, have you just run a general CPU profiler on your program to make sure that your frame time isn’t going to something that has little-to-nothing to do with GPU rendering and talking to the GL driver? If you’re on Windows, VerySleepy is free and super-simple to use.
I have measured framerate on both of them, on the R9 the numbers better, but the general matter is the same:
whole processing: IntelHD(37.4ms, 27.3fps); R9(28.6ms, 35fps)
without rasterizing: IntelHD(34ms, 29fps); R9(22.4ms, 45fps)
without sun shadows: IntelHD(30.7ms, 33fps); R9(27.2ms; 37fps)
Just did not create fragment shader (disabled all strings related it in the codebase).
As I know in that state driver using default fragment shader.
All the objects became white.
Not exactly.
I’m using DLShadowRenderer - the separate object that generates texture array with shadows.
Also I’m using Renderer - the general renderer that produces final frame using results of other renderers.
Thus:
‘without sun shadows’ means a disabling DLShadowRenderer: no producing of shadow textures.
‘without rasterizing’ means a disabling Fragment Shader in general renderer (but shadow textures may be produced in the same time, or may be not).
The matter is I have implemented some optimizations for shadow generation process, such as:
Separate rendering opaque and transparent objects. (for opaque ones used default FS).
The case is my levels almost flat, I’m using the first step culling on the in XZ plane using bounding quads. That process lets me cull much stuff very quickly on the CPU side.
Culling objects those produce shadows outside the frustum.
Using Geometry shader features: generation all cascade layers in the one pass, instancing for each shadow cascade layer.
It eats processing time, of course, but that acceptable.
That is what I thinking about in the beginning.
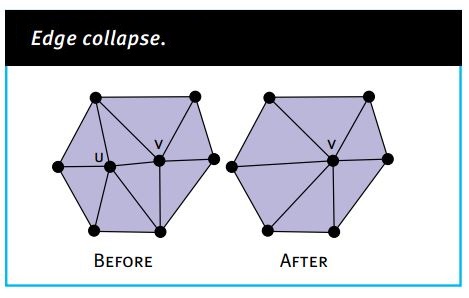
But for possibility of reducing vertex number I must implement some sort of ‘mesh simplification’.
Something like that:
It is not trivial at all, I think.
Culling implemented on the GPU side.
Unfortunately I’m working in linux.
But I don’t think there is CPU issue.
I think there are too many triangles go through pipeline, but I’m not sure of course.
Implementation of LOD lets me detect it.
Also I have to find a way to profiling GPU utilization under linux.
Ok, so still rasterizing, but using some possibly-unknown fragment state. So we can’t really rule out fragment bound based on this test. Cutting your resolution of all your render targets by 2X and 4X is another way to check.
If you weren’t so sure shadow map generation wasn’t a bottleneck, I’d suspect this. Geom shader instancing applied to many features can cost a lot of perf. It can be faster to render each split separately. You can cull features into all splits simultaneously with binning. And if you cull each split to its own frustum tightly fit around that split, you can cast the minimum number of verts/prims/frags into each split.
No, nothing like that. If you know that you’re not fragment bound, then it doesn’t matter much how many pixels on the screen you fill with whatever you draw. So if you then just cut back the number of vertices and primitives you’re rendering while keeping the number of batches and state changes constant (e.g. only render the first 50% of your existing batches; or the first 25%). Then you can take a look to see if/how the number of vertices/primitives sent down the pipe affects your performance.
Ok. As you said then, that’s another piece to check.
You can get the GL driver to tell you how many triangles/primitives, vertices, fragments, etc. you’re pushing through different stages of the pipeline with ARB_pipeline_statistics_query, if your driver supports it. It can tell you all kinds of things like how efficient your culling is. Failing that, you can add statistics to your engine to at least collect how many batches, primitives, and vertices you’re pushing down the GL pipeline from the application side.
If you suspect this, and you know that you’re not fragment bound, try cutting the number of triangles you send down the pipe by 2X, then 4X, and see what happens to your perf.