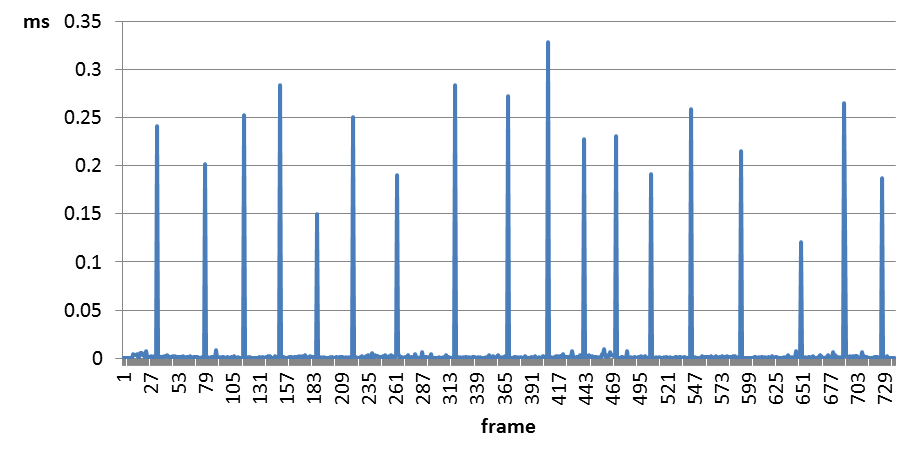
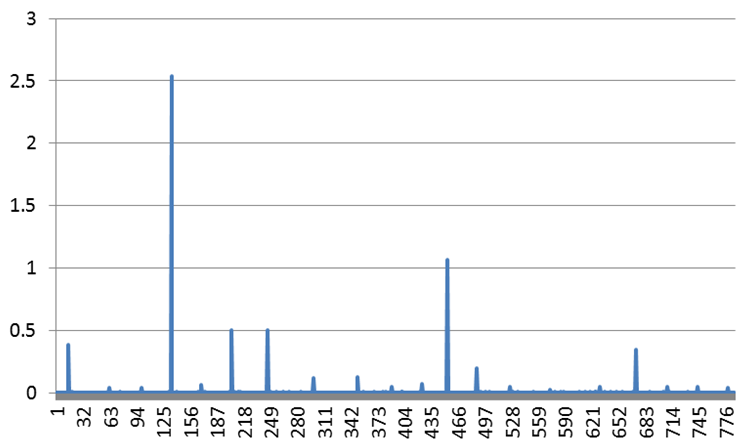
After a deep examination of my OpenGL-based application, I have discovered that a single function call makes severe frame-rate hiccups. The incriminated call is glBufferSubData(), but the problem occurs not in every frame, but in every 30th to 60th frame, as can be seen in the following figure.
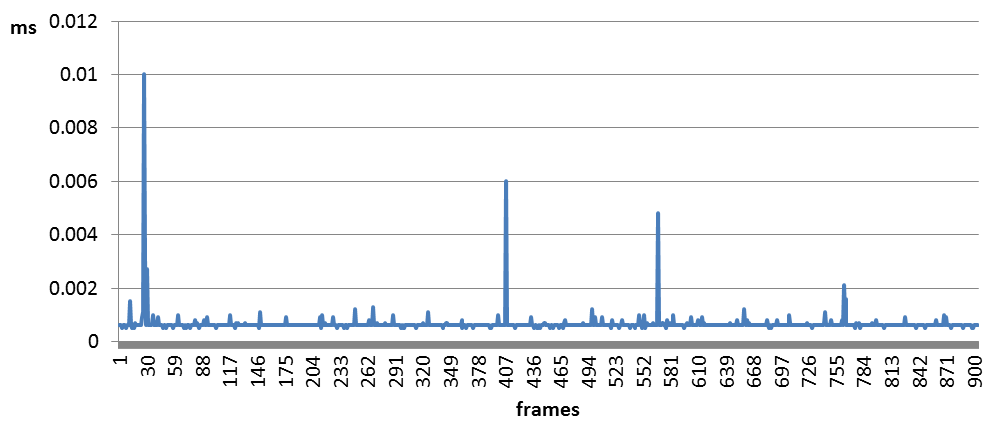
The problem does not occur in a debug GL context, although the debug context returns the following three notifications related to this glBufferSubData() call:
Buffer detailed info: Based on the usage hint and actual usage, buffer object 11 (bound to GL_VERTEX_ATTRIB_ARRAY_BUFFER_BINDING_ARB (0), and GL_ARRAY_BUFFER_ARB, usage hint is GL_DYNAMIC_DRAW) will be configured as STREAM.

Buffer detailed info: Buffer object 11 (bound to GL_VERTEX_ATTRIB_ARRAY_BUFFER_BINDING_ARB (0), and GL_ARRAY_BUFFER_ARB, usage hint is GL_DYNAMIC_DRAW) will use VIDEO memory as the source for buffer object operations.

Buffer detailed info: Buffer object 11 (bound to GL_VERTEX_ATTRIB_ARRAY_BUFFER_BINDING_ARB (0), and GL_ARRAY_BUFFER_ARB, usage hint is GL_DYNAMIC_DRAW) will use VIDEO memory as the source for buffer object operations.
However, the peak execution time is less than 0.01ms (GPU time) in a debug context, compared to up to 0.33ms when CONTEXT_DEBUG_BIT is not set.
glBufferSubData is not just a single function call - it potentially does a lot of work behind the scenes. The kind of things it might do include replacing part of the contents of a buffer, waiting for pending draw calls that use the old contents to complete, copying the new data to temporary memory, copying the new data from temporary memory to the real buffer, moving other things around in video memory to make room for the buffer, and many many more.
OpenGL doesn’t specify any of this, it just specifies functionality, so all it states is that when glBufferSubData returns, the implementation must behave as if the new data had been copied to the buffer. What the implementation actually does is dependent on the implementation, and in general you have no way of knowing.
The best way to avoid problems from this is to do what the doctor said when you told him “it hurts every time I do this” : don’t do this. In other words, update your buffers in a way that ensures you’re not dependent on pending GPU operations. Or better yet, keep your data static and run any animations in your shaders.
Yeah, what I’m saying is that glBufferSubData is not just “memcpy for buffers”, and even though the temptation might be there to treat it as such, because it’s storage is backed by a GL object, potentially in GPU memory, that’s being potentially used by other GL calls, you really shouldn’t.
In general there are three well-behaved ways to modify the contents of a buffer.
Don’t.
Using the streaming model, only write after the most recently written part. When the buffer is full, respecify it and start again from 0.
Replace the entire contents of the buffer.
Using 2 and 3, the driver can easily swap in new storage if the old storage is still in use, and can then either free the old storage when it’s no longer needed, or keep it around to quickly satisfy another potential future request for new storage.
But if you’re randomly jumping around a buffer updating arbitrary parts of it that may or may not have pending draw calls on them, sooner or later you are going to hit a part of the buffer that needs to wait for all pending operations to finish before it can be updated. At that stage what happens is no longer under your control, but you’re at the mercy of whatever heuristics your driver implements.
You’ve got some great suggestions from @mhagain and @GClements on possibly solutions.
But as far as the “what might be the problem” part of your question…
Before you rework your method, here are a few things you might check or try to get more insight into what’s going on here and when (or possibly avoid the issue altogether). It might save you time down-the-road:
You appear to be running on NVIDIA GL drivers on an NVIDIA GPU (your debug context output confirms this). Given that…
Things to check or try:
Are all of these glBufferSubData() calls uploading exactly the same amount of data at exactly the same cadence? (More data typically takes more time. Memory is slow.)
Are any driver “read” calls (e.g. draw calls that would cause reads) being issued between these buffer updates? Between which of them?
What GL driver configuration are you producing these glBufferSubData() frame time spikes in?:
Fullscreen Y / N? (<-- Fullscreen Y seems to unlock driver queue-ahead on Windows)
Windows?
VSync ON or OFF? (SwapInterval 1 or 0)
Mulththreaded driver enabled: Y / N? (<-- I’ve seen Y cause odd problems like this.)
Power Management Mode: Prefer Maximum Performance (<-- If this is not set, set it! I’ve seen power mgmt / dynamic GPU clocking cause all kinds of odd periodic frame time spikes like this.)
How many frames of queue-ahead (or are you letting the driver “run wild” with this)?
GPU?
GPU Driver Version?
Is this config one users would normally run your app in? Or is this a “developer debug/profiling” config?
To disable queue-ahead, try ending your frames with this sequence. Does this “fix” it?
SwapBuffers()
glClear() window FB
glFinish()
Your buffer is being left in GPU memory (based on your NV driver debug output). To force-move it to CPU memory (where it’s likely cheaper to update from the CPU), try doing this once immediately after creating the buffer object storage. Does this “fix” it?:
glUnmapBuffer( GL_ARRAY_BUFFER )// <-------------- ADDED!
You might need to change the storage alloc from glBufferStorage() to glBufferData() for this … not sure.
To try severing internal driver dependencies between users of the previous and next content of the buffer object, try orphaning the buffer object before you update it, like this. Does this “fix” it?:
Try running this under Nsight Systems, without GL debug enabled. It might give you some indication of the underlying issue causing the spikes (…or it might not reproduce).
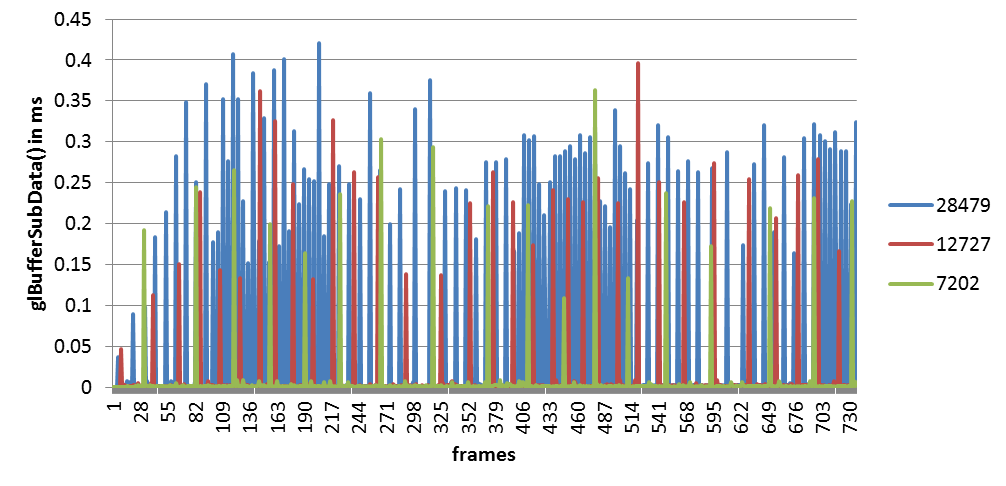
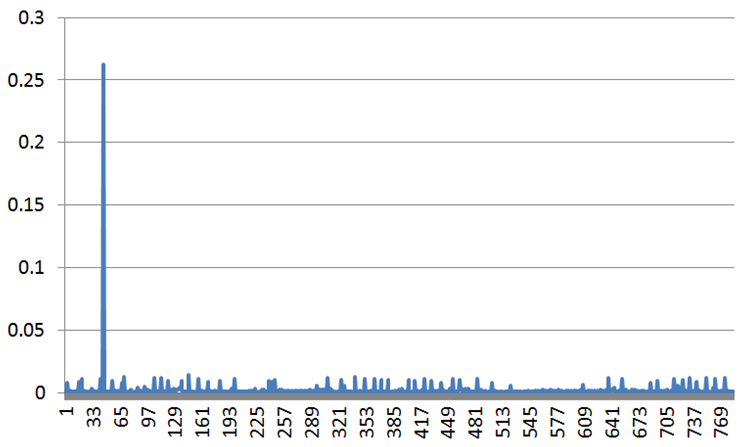
Thank you so much for the response, mhagain. You are probably right with the assumption that the previous drawing is not finished when the next update happens. As it can be seen in the following figure, with reducing the average size of the update (from 28479, over 12727, to 7202 attributes), the frequency of the peaks also reduces.
I do update the whole buffer; however, I have allocated more space than I need (since the number of attributes being used from frame to frame varies) and update just the first (variable length) part of it.
GClements, thank you, too! I have tried orphaning (after replacing glBufferStorage() with glBufferData() in the initialization routine, and calling glBufferData() with NULL at the end of each frame), but it changed nothing.
Now I really struggle with the thought to abandon all modifications, since all this is just an alternative path for something that is also implemented using task/mesh shaders and with no attributes at all. The instancing version is aimed at older and non-NVIDIA graphics cards. Unless frame rendering time is below 10ms (and it is so in most cases), additional 4ms peak cannot be perceived during execution.
On the other hand, if everything renders in 4-5ms on a pretty weak GPU, an additional 4ms, even in every 30th frame is unacceptable.
If anyone has some useful hint, I’ll be glad to hear about. The additional problem is that the updates are not the same size, and I don’t know in advance the maximum size of the update. Of course, there is the absolute maximum (defined in the storage size), but the real updates are usually considerably smaller.
Going back to try to understand the update pattern some more, is this an individual update per mesh, or is it just a single update for all meshes? And how many times do you update per frame?
Drak_Photon, thank you so much for the proposed solutions and clues!
Every update has a slightly different amount of data, but the maximum is about two times bigger than the minimum. For example, the number of attributes in the first example ranges from 5076 to 9328. The update is very steady – every frame.
The incriminated buffer is updated once per frame, but reused several times in draw calls (up to dozen times, but usually half a dozen).
The window is maximized (with no bars), but it cannot be considered a fullscreen mode. So, No.
Yes
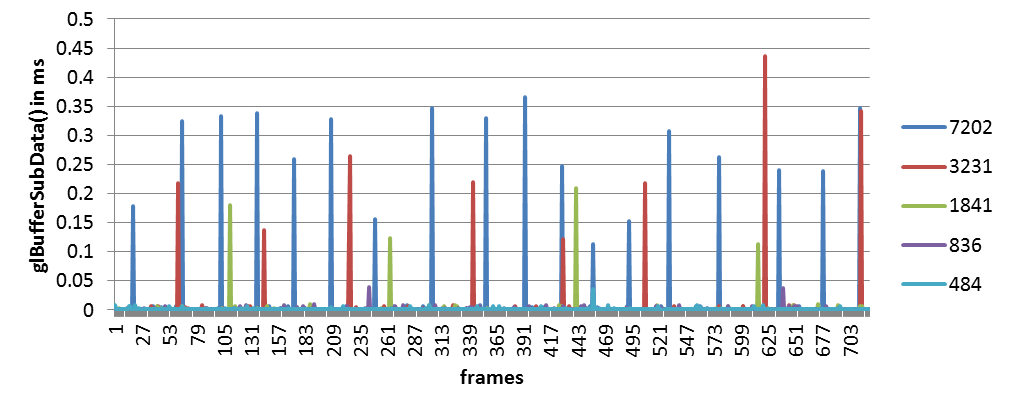
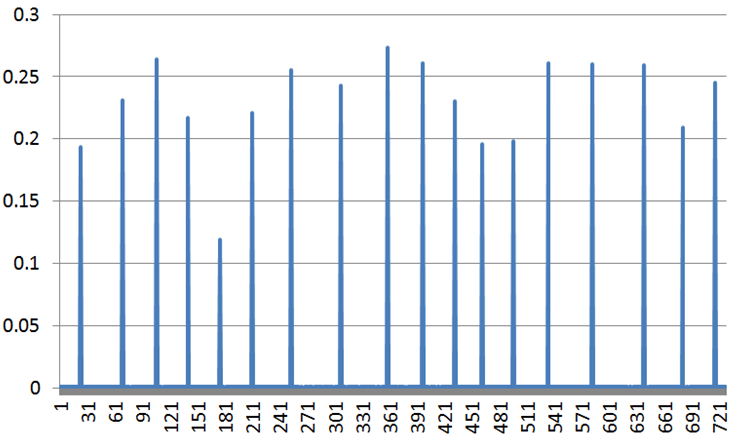
VSync is ON. wglSwapIntervalEXT(1). Interestingly, by switching it off, the situation improves, as can be seen in the following figure. It is odd that with 4x more frequent updates things are better. This calls into question the previous conclusion, that the previous drawings block the update.
No. Multithreaded driver is not enabled. (I guess, since there is no such option now in NV Control Panel. If I remember correctly, there was such an option a long time ago, but I didn’t play with it). Threaded optimization – Auto. I need to reinstall drivers since NV Control Panel doesn’t function correctly.
Yes (Power Management Mode: Prefer Maximum Performance). It is already set in order to get a correct frame rendering time (to avoid performance state change caused by low utilization).
I need a bit of clarification here (how many frames of queue-ahead…). I’m not sure what you are talking about.
Various GPUs are used. All previous charts are from GF 850M (laptop), but the situation is similar elsewhere.
471.11
Yes, currently I’m using regular drivers with no instrumentation. All debugging/profiling is embedded in the application with (almost) no impact on the performance.
WOW! Remarkable! I remember that you suggested this to someone somewhere several years ago, but I haven’t tried it till now. Works like a charm! With VSync off, there was just a single spike.
It doesn’t change anything. I guess the buffer must be allocated with glBufferData(), since glBufferStorage() makes an immutable object.
I didn’t know that this function exists (glInvalidateBufferData()). Thanks for the update (I had to update my API initialization routine. ) But, … it doesn’t change anything.
I really don’t like NSights since it is extremely heavyweight. But, if the problem persists, maybe I’ll give it a chance.
This is a single update for several meshes and it is done once per frame.
Turning off VSync alone, as Dark Photon suggested, almost removes the problem. VSync off with forcing glFinish() after SwapBuffers() removes it completely. However, without VSync the animation speed significantly depends on the GPU speed, so I need additional effort to control it.
Oh. Well the GL driver will frequently allow you to queue 0-N frames worth of rendering calls ahead of the frame currently displayed (or rather, last given to the swap chain for display). You say you’re not rendering true Fullscreen, so you may not be getting any queue ahead but…
The driver controls for this have varied over the years, from the poorly named “Max Prerendered Frames” to the more recent “Low Latency Mode” and “VR Low Latency Mode”. In any case, those are the controls the driver gives you for how far it allows your app to queue ahead (when rendering in Fullscreen Flipmode). But the application itself can limit how far it allows itself to queue ahead (and/or measure how far it “is” queuing ahead) using sync objects submitted after each frame. If there are too many outstanding (submitted-but-not-completed) frames, it can block so it doesn’t get further ahead than it wants.
Seeing laptop, I’m assuming GL rendering has been forced to use the NVIDIA GPU, not the embedded GPU.
Ok, cool. That’s something anyway.
The driver can block pretty well anywhere it wants. The key with VSync ON is whether the display rate is pretty solidly locked onto the VBlank rate. If you were rendering FlipMode (FullScreen+Focus) on the Primary Monitor, that’d likely be “the” VBlank rate for the monitor. However IIRC, with windowed mode, your display routes through WDM compositoring so you’re syncing to its virtualized display clock.
That said, when running VSync ON, you can view that display rate indirectly in your application’s draw thread. With VSync ON, check how consistent your frame times are by measuring them from after SwapBuffers()+glClear window+glFinish() to that same point at the end of the next frame. This time delta should be very solidly locked at 60Hz (or 90Hz, 120Hz, … whatever your display rate is), unless you’re overrunning your time budget on the CPU or GPU.
Oh and also, in the NVIDIA control panel, make sure you have: Triple Buffering: OFF. This gives you lower display latency (good) and makes it easier to see when you blew your time budget on the CPU or GPU. Also, for profiling purposes, you want Display Technology = Fixed Refresh – none of this G-Sync musical frame times stuff.
Oh, one other idea for you related to this spike. For testing only with VSync ON, try kicking a glFlush() before your glBufferSubData() call. What I’m wondering is if perhaps the NV driver might occasionally be flushing queued-but-unsubmitted work to the back-end driver inside of your call to glBufferSubData(). If you flush the work before calling glBufferSubData() and the time spike in glBufferSubData() goes away, then that could be the cause.
Ok. When the NVIDIA driver moves a buffer object from “video memory” to “host memory” (i.e. GPU mem to CPU mem), it’ll tell you with one of those Buffer detailed info:... GL debug messages you quoted above.
I have performed a clean installation of new (473.04) drivers for my laptop, and must admit that there are some new options, like “OpenGL rendering GPU”. Although it is quite simple to activate the NV card on the Optimus platform from the code, by just adding the following line:
Following your advice, thread optimization is switched off. And … I cannot believe it! All symptoms are gone! Literally, every time “Thread optimization” is set to Auto or On, spikes return. It’s good to know you’re not doing anything wrong.
Thank you, Dark Photon, so much! I didn’t pay attention to this option thus far, and that was such a mistake.