A bottleneck while rendering to depth map

My opengl renderer draws the following scene (i.e. 2000-3000 instances of a tree model in a single drawcall):


5-6 times slower than a scene with a clear terrain.

I disabled all unneeded effects and figured out that the problem is in shadow map rendering. Also, the problem is definitely NOT in CPU overhead and not in vertex stages. I’ll skip investigation of these facts.

Then I reproduced the same scene in UE5 (Vulkan) and didn’t see such a dramatic fps drop there.

Using Nsight debugger I matched all rasterizer and pixel op state of my renderer to UE’s state and profiled a depth map drawcall in both engines.

Shadow map size is 2048 in both cases, and some other metrics are these:

UE My renderer
Input primitives 7.5M 1.7M
Shaded fragments 145M 152M
SM warp stall scoreboard 21% 34%
SM warp stall drain 0.3% 22%

All other metrics in profiler’s SM sections are almost the same.

SM warp stall scoreboard for considered shader is actually a percentage of SMs waiting for a texture lookup, and SM warp stall drain is a percentage of SMs waiting for memory writes after exiting.

So UE processes much more vertices, writes almost the same amount of fragments and works fast.

A slight difference in SM warp stall scoreboard could be due to usage of uncompressed textures in my test scene.

Thus the key to UE’s performance in this drawcall is absence of stall drain.

But why do SMs under UE don’t stall?

The only difference I didn’t mention above is that my engine draws to a single shadow map, while UE draws to 4 cacsaded shadow maps 2048 pixels each.
So UE’s 145M fragments are distributed over four maps, and SMs don’t wait each other on writes.
Is it a viable guess? If not, what else am I missing?

PS.
Another observation: if I comment out discard statement (leading to early Z enabling), or forcibly enable early Z test in my engine, it works much faster and doesn’t stall on drain anymore.

Also, there is no critical bottleneck for my hardware between 145M and 152M of shaded fragments. I profiled the scene with 85M fragments only in my engine, and still got 22% of SM warp stall drain.

I know that 145M frags on 2048x2048 buffer is a huge overdraw, but I have to draw this model.

Interesting post.

You’ve done some good digging here. That said, there’s a lot left unspecified. And possibly considerable difference between how you’re rendering the scene and how UE5 is (beyond the diffs you called out). Unless you’ve matched everything in the GL call traces.

Here are some random thoughts that may or may not help you determine where to dig next:

What kind of draw call? glDrawElements()? glMultiDrawElementsIndirect()? If the latter, are trees separate sub-draw records? If so, that could cause low vertex shader SM throughput.

However, you said you’re sure the issue isn’t vertex. If true, you should be able to cut your screen res down 2x2 or 4x4 while keeping the same field-of-view and see your biggest bottleneck disappear.

Ok. So avoiding fragment shader executions for occluded fragments, and potentially avoiding even scheduling warps/wavefronts at all for whole tiles of occluded fragments. Makes sense that’d benefit.

Also, IIRC any operation that runs afoul of Hi-Z / ZCULL disables it, resulting in lower (potentially much lower) pre-shading fragment rejection for everything that follows.

What kind of blending are you doing here? BLEND or MSAA alpha-to-coverage?

Generating the shadow map? Or applying the shadow map to the scene?

From the thread subject, it sounds like the former. Given that, are you using a special shader program that only generates depth? Or are you doing a tex lookup to kick discard on low alpha values? If the latter, when you comment out the discard statement, shader dead-code elimination could be completely killing off the texture fetch and the overhead it imposes.

That’s a pretty big difference, particularly when you’re fingering shadows as the biggest bottleneck.

When you disable shadow generation and application in both renderers, is the perf nearly identical?

Thank you for elaborated reply!

What kind of draw call?

In my engine there is no MDI, just one call to glDrawElementsInstancedBaseVertex.

In UE I compare to a renderpass of 4 subprasses , which render the following:

  1. Some boxes, not more than 100 vertices overall, and little to no overdraw
  2. Hundreds of instances of the tree model

They run in parallel for each cascade and switch the program: tree program has a fragment stage (it needs to discard frags), and box program has no frag stage.

Boxes really don’t make any noticeable impact. This is what UE shadowmap finally looks like:

Maybe shader invocations in parallel VK passes are scheduled more efficiently than in single glDrawElementsInstanced?

you should be able to cut your screen res down 2x2 or 4x4 while keeping the same field-of-view and see your biggest bottleneck disappear.

Inspected drawcalls in both engines draw to an offscreen target, but yes, I tried to downsize it from 2048 to 512 in my engine, and this bottleneck goes away. Also I just inspected the stalls for 512-sized map and got 14% (instead of 34%) for tex lookup and 2% (vs 22%) for drain.

Both engines render to 16-bit depth map.

What kind of blending are you doing here? BLEND or MSAA alpha-to-coverage?

Blending and MSAA are disabled, and also as much postprocessing features as possible are disabled in both engines. In my engine I only left lighting pass and gamma correction.

Anyway, I’m profiling not the FPS rate, but one exact drawcall (see next question)

Generating the shadow map? Or applying the shadow map to the scene?

Generating shadow map, i.e. the instanced drawcalls which renders to the map. These drawcall(s) take 45-50% in UE and 55-65% in my engine, while in absolute units it’s 10ms in UE and 14-25ms in my engine when writing an equivalent amount of fragments.

Applying shadow map i not an issue for now, as it happens only once per pixel in the lighting pass which is fast enough.

Given that, are you using a special shader program that only generates depth? Or are you doing a tex lookup to kick discard on low alpha values?

Both engines use a trivial fragment stage for trees like this:

uniform sampler2D colorTex;
smooth in vec2 tc;
void main()
{
   if (texture(colorTex, tc).a < 0.5) discard;
   // No color output as the rednertarget for this program has no color attachments.
   // Discarded fragments just don't get compared and written to the depth buffer.
}

shader dead-code elimination could be completely killing off the texture fetch and the overhead it imposes.

That is, but I got exactly the same performance boost if I leave the shader untouched (i.e. it still samples the texture), but forcibly enable early frag test with layout(early_fragment_tests) in;

When you disable shadow generation and application in both renderers, is the perf nearly identical?

No, because other parts of the frame are different, and the APIs are different too:

UE uses full-featured VUlkan, while I can only use Opengl 3.3 with some 4.3 features and almost no azdo practices. That’s why the test scene is refined to have minimal amount of api calls and to expose performance of only two drawcalls: one for shadow and one for color.

UE has huge bits per pixel in it’s gbuffer, but it performs depth prepass.

I don’t do depth prepass but I have much thinner gbuffer, and there are many other differences.
But I think these differences are irrelevant because I compare one drawcall with a renderpass of few drawcalls which are not vertex bound and write an identical amount of fragments.

Color pass (rendering to gbuffer) in my engine is not perfect too, but for now it performs satisfactory, and much faster (to fullHD target, while shadow writes to 2048x2048) than shadow pass, despite it writes color values.

Definitely an interesting problem. Doesn’t sound like we have control over all the differences between UE’s rendering and your renderer’s rendering, but here are a few more ideas for things you might check to help track this down:

  • Backface culling enabled?
  • DepthFunc LESS not LEQUAL? (greater depth test rejection)
  • SCISSOR_TEST, STENCIL_TEST, ALPHA_TEST, BLEND all disabled?
  • GL_POLYGON_OFFSET_FILL disabled?
  • PolygonMode FRONT_AND_BACK = FILL?
  • ColorMask(0,0,0)? StencilMask(0)?
  • GL_MULTISAMPLE and POLYGON_SMOOTH disabled?
  • All of the above are “not” changed between glClear( DEPTH ) and the end of shadow render?
  • 16-bit indices? (2X rate on some hardware; not sure but might affect fragment scheduling)

Could be, on your specific GPU+driver.

Might be worth comparing perf against glDrawElements (non-instanced) with pseudo-instanced tree geom. Just to verify that instanced isn’t triggering some less efficient rasterization scheduling.

And you confirmed it’s not MultiDrawIndirect (MDI), so this issue probably isn’t coming into play, though it could conceivably for DrawInstanced. Just in case it does and this might trigger some fragment scheduling inefficiency, it’s probably worth comparing against glDrawElements

  • How does the UE depth prepass affect shadow gen render? Or does it?
  • I wonder if UE is doing some implicit small feature culling.

That’s worth testing. Though I’d suspect you’re getting good texture cache hits.

Do your tree textures have MIPmaps? And you have trilinear filtering enabled? (Less texture lookups, smaller texture cache footprint)

Is the alpha in your renderer’s texture MIPmaps computed the same way as in UE? (That goes to discard rate.)

It could be. It certainly is a difference. But given what you’ve mentioned above, I’m not sure this conclusion follows.

Could be. But in your image above, you’re looking at a top-down view. So all the trees are probably being plastered into the same split (…depending on how UE choses the split distances).

You could force UE to always use one split. That’d be more similar to your renderer. And on that note…

Syncing the shadow gen near/far between UE and your renderer may be very important for depth precision and fragment acceptance/rejection rate, particularly with a small 16-bit depth buffer and all the geometry rendered at approx the same depth.

Ok, except if your analysis of “SM warp stall drain” is correct (0.3% → 22%), then more of them are stalled waiting on writes. Might suggest fewer fragments rejected by the depth test (and/or discard) and having to update the depth buffer in your renderer.

On that note, you might look at these GL pipeline statistics in your renderer, and compare to the same in UE if you can. Could provide some useful clues:

  • GL_FRAGMENT_SHADER_INVOCATIONS_ARB
  • GL_CLIPPING_INPUT_PRIMITIVES_ARB
  • GL_CLIPPING_OUTPUT_PRIMITIVES_ARB

Maybe some differences in frustum culling at-work here?

Ok, that’s still going to kill off more fragment shader executions, and avoid more texture lookups/stalls and fragment depth writes/stalls.

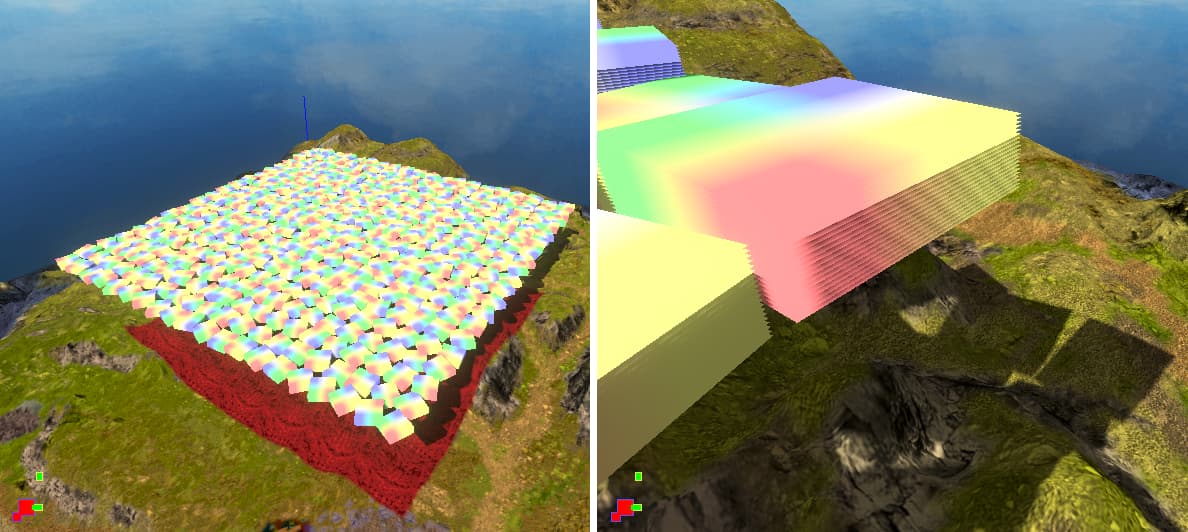
First, I sandboxed the problem even more. Now the scene is 400 instances. The model is 20 quads and each quad is 2 triangles.

I tried to render differently arranged quads: from top to bottom and vice versa. No difference in FPS or stalls. Looks reasonable because depth test and (probably) write after fragments shader could be not just a write operation, but an atomic read-modify-write.

The terrain under quads is not that hard to render because it’s cached while the camera does not move. It does not get rendered, it only gets blitted in a few calls.

Also I tested how vertex processing impacts FPS:

  1. Render quad models with disabled frustum culling while not looking at them, so all vertices get processed, but primitives get clipped.
  2. Render the same scene without models.

There is not difference between these two setups.

Backface culling enabled?
SCISSOR_TEST, STENCIL_TEST, BLEND all disabled?
GL_POLYGON_OFFSET_FILL disabled?
PolygonMode FRONT_AND_BACK = FILL?
GL_MULTISAMPLE and POLYGON_SMOOTH disabled?

Yes for all these, I meant it under “rasterizer and pix ops state” in the initial post.

Other options are more interesting.

DepthFunc LESS not LEQUAL?

In the initial test it was LEQUAL, however on the new scene with quads there should be no difference between them. Ok, I switched to LESS and measured no difference in fps and profiler.

ALPHA_TEST

So ancient that there is no such field in frame debugger :slight_smile:
Nevertheless, I disabled it manually and got no difference.

ColorMask(0,0,0)? StencilMask(0)?

They were enabled as I assumed it’s OK because shadowmap has stencil and no color attachments. Again disabled explicitly for test, nothing changed.

All of the above are “not” changed between glClear( DEPTH ) and the end of shadow render?

As I mentioned above, the terrain is cached and gets blitted to the shadowmap before any other rendering. It works perfect in our camera restrictions, so there is no glClear for shadowmap.
Nevertheless, I ensured that all the state changes you advised are made before blitting.
So between blitting and the drawcall there are only VAO binding, some SSBO bindings, a few glUniform* calls and texture bindings.

16-bit indices?

Surely. And not 8 bit because many AMD drivers complain about performance issues with 8 bit indices to debug output.

Could be, on your specific GPU+driver.

Maybe, but initial problem with trees appeared on a wide variety of Nvidia and AMD gpus. Here I’m not sure if it’s the same problem on all gpus.

How does the UE depth prepass affect shadow gen render? Or does it?

It does not affect. It prepasses the scene from the view camera before shadow rendering, but does not sample the prepassed depth from shadowmap generating program.

I mentioned the prepass just to point the difference between my and UE’s color pass.

I wonder if UE is doing some implicit small feature culling.

Looks like it’s not doing. Closely viewed colored trees and furthest slice (i.e. less detailed) shadowmap trees have the same amount of vertices. If it can, it definitely needs explicit enabling and tuning.

That’s worth testing. Though I’d suspect you’re getting good texture cache hits.

Texture in the old scene was 256x256, and the texture in the new scene is 4x4. Both with mipmaps. 4x4 should reside in texture cache entirely on any hardware.

Is the alpha in your renderer’s texture MIPmaps computed the same way as in UE?

Good point. No, not the same way. I just compare alpha to 0.5, and UE does some more arithmetics (still in one line of code), which I didn’t look into deeply.

Could be. But in your image above, you’re looking at a top-down view. So all the trees are probably being plastered into the same split

With no tuning UE draws the scene with an ugly seam between shadow cascades which is well visible in moving camera, so first I tuned the camera to see 2 or 3 seams, and then verified that 3 or 4 splits are drawn into with frame debugger.

You could force UE to always use one split.

I tried, but unsuccessfully for now, will continue later. To be more specific, I made UE to use one split, but it looked like the less detailed one, because it rendered all the scene to only a small chunk of the shadowmap, and I didn’t find yet how to tune shadow bounding volume.

Syncing the shadow gen near/far between UE and your renderer may be very important for depth precision and fragment acceptance/rejection rate.

Good point too! I didn’t compare to UE yet, but made anothe experiment.
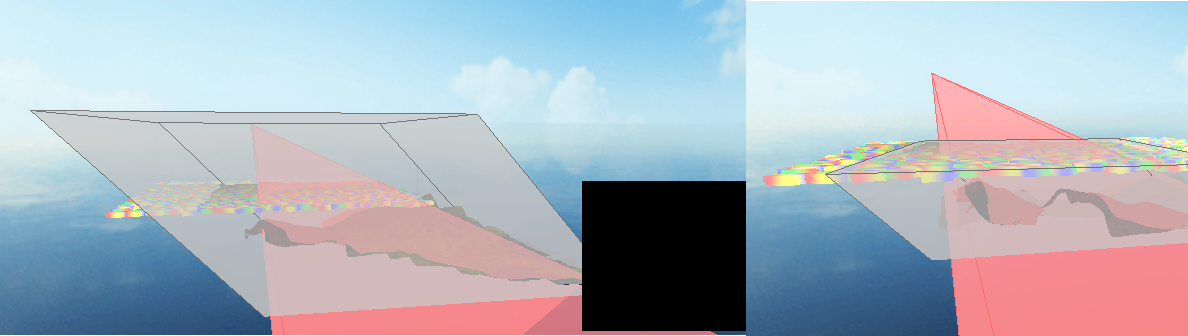
In my renderer it’s possible to “freeze” the shadow volume and look at it from aside. On the screenshots shadow near and far planes are horizontal planes of the grey volume, that is parallel to model’s quads and almost parallel to the sight vector. Left screenshot is what they were initially, and the right one is after tuning. I think both variants are good enough for 16 bits. For example, in the right screenshot the distance between shadow’s near and far is approximately 200, and distance between model’s quads is 5.

Could provide some useful clues

GL_FRAGMENT_SHADER_INVOCATIONS_ARB should be the same as Shaded fragments from the first post. In the first post I was talking about 140-150M of shaded fragments, while in the new sandbox I see the effect (fps drop and drain stall) on 50-60M of shaded fragments. The only difference of less fragments is that absolute FPS is higher.

I payed attention at GL_CLIPPING_INPUT_PRIMITIVES and GL_CLIPPING_OUTPUT_PRIMITIVES in the debugger from the very beginning, and it seems to be OK.

clip-io

UE’s out/in ratio is usually lower.

Fow now I didn’t try only few things you advised:

  • Bake instances into a single pseudo-instanced model.
  • Make UE fill the whole shadowmap with one slice, and try to sync near-far distance in UE and my engine.

Will do it a bit later and report the results.

I suspect then you’re not going to get a properly initialized Hierarchical-Z data structure built to pre-cull entire rasterization tiles (warps/wavefronts) that are occluded. That’s the root of the above question. If at all possible, trying to get a Hi-Z built and used for as much of the render target draw as possible, to pre-reject as much as possible before you have to run fragment shaders.

discard may thwart some use of that though, depending on how Hi-Z updates are done.

Another thought: I wonder if UE is doing some triangle order optimization that results in packing more tris into nearby screen tiles, yielding better framebuffer cache coherence. (…just pulling ideas out of the air at this point).

Ok.

On alpha values, discard efficiency, and Hi-Z … Given that the shadow render is fragment bound, I wonder if UE’s doing an opaque pre-pass before doing anything that would offend (partially/completely disable) Hi-Z, to maximize use of it for the longest time. For instance, rendering opaque cores first and then translucent fringes with tex lookup+discard, which may hinder/disable Hi-Z from that point on.

Really? That’s surprising. Been there, done that. There are shader tricks to avoid this.