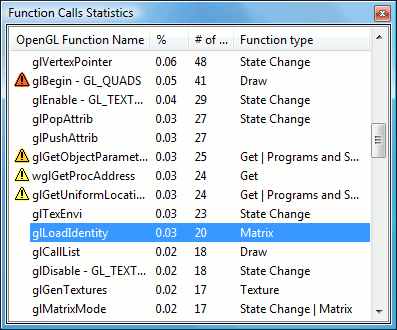
The new V2.3 introduces a Calls Statistics view that allows viewing the number of times each OpenGL function call was executed in the previous frame and it’s percentage from the total functions execution count.

The list is updated each and every time the process is suspended. This insight information helps you locate (and then remove) redundant OpenGL function calls, state changes, etc.
The functions below are divided and listed by their enumerators to provide more precise information.
- glBegin
- glBindBuffer
- glBindBufferARB
- glBindTexture
- glDisable
- glDisableClientState
- glDrawArrays
- glDrawElements
- glDrawRangeElements
- glEnable
- glEnableClientState
- glMultiDrawArrays
- glMultiDrawArraysEXT
- glMultiDrawElements
- glMultiDrawElementsEXT
- glTexParameterX
This version also adds support for GL_ARB_texture_rectangle and GL_NV_texture_rectangle extensions and introduces a new GUI layout and docking system.
Trial version can be downloaded from here .
Regards,
The gDEBugger team