The following is a description of the problem that prompted this question, but I’ve solved it (silly mistake) and I’m more interested in discussing how to approach profiling / improving performance in Vk projects in general:
I ported a simple OpenGL application so that it can also run in Vulkan the other day. To test performance, I set it up to render the same single mesh, with 67,907 triangles per mesh, 1,600 times in an array across the screen, without using any indexinginstancing. I’m using simple Push Constants to push three transformation mat4s on Vulkan, and regular uniforms in OpenGL. The shaders are identical apart from slight adaptations to make them compatible with Vulkan (i.e. adding locations for out parameters on the VS, creating a push_constants structure for uniforms, etc.).
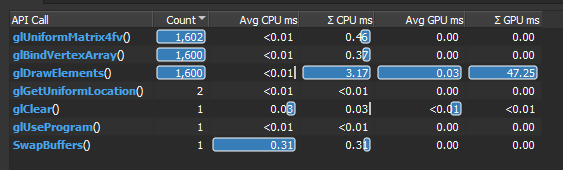
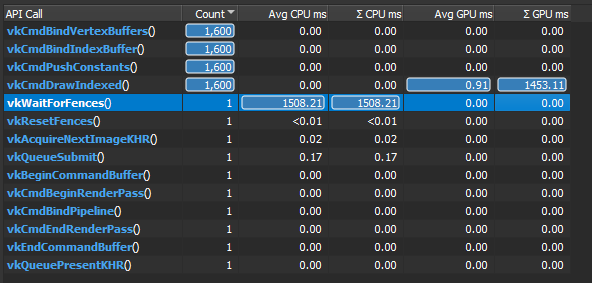
The OpenGL version runs at 20 FPS on an NVIDIA RTX 2070. The Vulkan version runs this same scene at 0.66 FPS. I’ve run both through NSight and I can’t seem to find exactly what the bottleneck is - all I know is that vkCmdDrawIndexed takes a lot longer than glDrawElements:
What’s the best way to work out the kinks in weird behavior like this? Not for this case in particular (…mainly because just while writing this I realized I’m using host coherent memory, and after fixing that and using device-local it runs slightly faster… -_-), but in general - how do I approach an issue like this when trying to optimize my Vulkan code?